Elementary Statistics Using The Ti-83/84 Plus Calculator
5th Edition
ISBN: 9780134686943
Author: Triola, Mario F., Iossi, Laura
Publisher: Pearson,
expand_more
expand_more
format_list_bulleted
Concept explainers
Videos
Textbook Question
Chapter 3.1, Problem 18BSC
Critical Thinking. For Exercises 5–20, watch out for these little buggers. Each of these exercises involves some feature that is somewhat tricky. Find the (a)
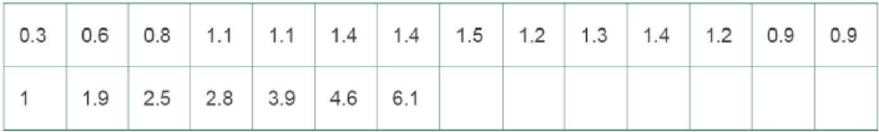
18. Sales of LP Vinyl Record Albums Listed below are annual U.S. sales of vinyl record albums (millions of units). The numbers of albums sold are listed in chronological order, and the last entry represents the most recent year. Do the measures of center give us any information about a changing trend over time?
Expert Solution & Answer
Want to see the full answer?
Check out a sample textbook solution
Students have asked these similar questions
Elementary StatisticsBase on the same given data uploaded in module 4, will you conclude that the number of bathroom of houses is a significant factor for house sellprice? I your answer is affirmative, you need to explain how the number of bathroom influences the house price, using a post hoc procedure. (Please treat number of bathrooms as a categorical variable in this analysis)Base on the same given data, conduct an analysis for the variable sellprice to see if sale price is influenced by living area. Summarize your finding including all regular steps (learned in this module) for your method. Also, will you conclude that larger house corresponding to higher price (justify)?Each question need to include a spss or sas output.
Instructions:
You have to use SAS or SPSS to perform appropriate procedure: ANOVA or Regression based on the project data (provided in the module 4) and research question in the project file. Attach the computer output of all key steps (number) quoted in…
Elementary StatsBase on the given data uploaded in module 4, change the variable sale price into two categories: abovethe mean price or not; and change the living area into two categories: above the median living area ornot ( your two group should have close number of houses in each group). Using the resulting variables,will you conclude that larger house corresponding to higher price?Note: Need computer output, Ho and Ha, P and decision. If p is small, you need to explain what type ofdependency (association) we have using an appropriate pair of percentages.
Please include how to use the data in SPSS and interpretation of data.
An environmental research team is studying the daily rainfall (in millimeters) in a region over 100 days.
The data is grouped into the following histogram bins:
Rainfall Range (mm) Frequency
0-9.9
15
10 19.9
25
20-29.9
30
30-39.9
20
||40-49.9
10
a) If a random day is selected, what is the probability that the rainfall was at least 20 mm but less than 40
mm?
b) Estimate the mean daily rainfall, assuming the rainfall in each bin is uniformly distributed and the
midpoint of each bin represents the average rainfall for that range.
c) Construct the cumulative frequency distribution and determine the rainfall level below which 75% of the
days fall.
d) Calculate the estimated variance and standard deviation of the daily rainfall based on the histogram data.
Chapter 3 Solutions
Elementary Statistics Using The Ti-83/84 Plus Calculator
Ch. 3.1 - Prob. 1BSCCh. 3.1 - Prob. 2BSCCh. 3.1 - Measures of Center In what sense are the mean,...Ch. 3.1 - Prob. 4BSCCh. 3.1 - Critical Thinking. For Exercises 520, watch out...Ch. 3.1 - Prob. 6BSCCh. 3.1 - Critical Thinking. For Exercises 520, watch out...Ch. 3.1 - Prob. 8BSCCh. 3.1 - Prob. 9BSCCh. 3.1 - Critical Thinking. For Exercises 520, watch out...
Ch. 3.1 - Critical Thinking. For Exercises 520, watch out...Ch. 3.1 - Prob. 12BSCCh. 3.1 - Prob. 13BSCCh. 3.1 - Prob. 14BSCCh. 3.1 - Critical Thinking. For Exercises 520, watch out...Ch. 3.1 - Critical Thinking. For Exercises 520, watch out...Ch. 3.1 - Prob. 17BSCCh. 3.1 - Critical Thinking. For Exercises 520, watch out...Ch. 3.1 - Prob. 19BSCCh. 3.1 - Critical Thinking. For Exercises 520, watch out...Ch. 3.1 - Prob. 21BSCCh. 3.1 - In Exercises 2124, find the mean and median for...Ch. 3.1 - Prob. 23BSCCh. 3.1 - In Exercises 2124, find the mean and median for...Ch. 3.1 - Prob. 25BSCCh. 3.1 - Prob. 26BSCCh. 3.1 - Prob. 27BSCCh. 3.1 - Prob. 28BSCCh. 3.1 - Prob. 29BSCCh. 3.1 - In Exercises 2932, find the mean of the data...Ch. 3.1 - Prob. 31BSCCh. 3.1 - Prob. 32BSCCh. 3.1 - Prob. 33BSCCh. 3.1 - Prob. 34BSCCh. 3.1 - Prob. 35BBCh. 3.1 - Prob. 36BBCh. 3.1 - Trimmed Mean Because the mean is very sensitive to...Ch. 3.1 - Prob. 38BBCh. 3.1 - Prob. 39BBCh. 3.1 - Prob. 40BBCh. 3.1 - Prob. 41BBCh. 3.2 - Range Rule of Thumb for Estimating s The 20 brain...Ch. 3.2 - Range Rule of Thumb for Interpreting s The 20...Ch. 3.2 - Variance The 20 subjects used in Data Set 8 IQ and...Ch. 3.2 - Symbols Identify the symbols used for each of the...Ch. 3.2 - In Exercises 520, find the range, variance, and...Ch. 3.2 - In Exercises 520, find the range, variance, and...Ch. 3.2 - In Exercises 520, find the range, variance, and...Ch. 3.2 - In Exercises 520, find the range, variance, and...Ch. 3.2 - Prob. 9BSCCh. 3.2 - Prob. 10BSCCh. 3.2 - Prob. 11BSCCh. 3.2 - Prob. 12BSCCh. 3.2 - Prob. 13BSCCh. 3.2 - Prob. 14BSCCh. 3.2 - Prob. 15BSCCh. 3.2 - Prob. 16BSCCh. 3.2 - Prob. 17BSCCh. 3.2 - Prob. 18BSCCh. 3.2 - Prob. 19BSCCh. 3.2 - In Exercises 520, find the range, variance, and...Ch. 3.2 - Prob. 21BSCCh. 3.2 - In Exercises 2124, find the coefficient of...Ch. 3.2 - Prob. 23BSCCh. 3.2 - Prob. 24BSCCh. 3.2 - Prob. 25BSCCh. 3.2 - Prob. 26BSCCh. 3.2 - Prob. 27BSCCh. 3.2 - Prob. 28BSCCh. 3.2 - Prob. 29BSCCh. 3.2 - Prob. 30BSCCh. 3.2 - Prob. 31BSCCh. 3.2 - Prob. 32BSCCh. 3.2 - Prob. 33BSCCh. 3.2 - Prob. 34BSCCh. 3.2 - Prob. 35BSCCh. 3.2 - Prob. 36BSCCh. 3.2 - Prob. 37BSCCh. 3.2 - Prob. 38BSCCh. 3.2 - Finding Standard Deviation from a Frequency...Ch. 3.2 - Prob. 40BSCCh. 3.2 - Prob. 41BSCCh. 3.2 - Prob. 42BSCCh. 3.2 - Prob. 43BSCCh. 3.2 - Chebyshevs Theorem Based on Data Set 3 Body...Ch. 3.2 - Prob. 45BBCh. 3.2 - Prob. 46BBCh. 3.3 - z Scores LeBron James, one of the most successful...Ch. 3.3 - Heights The boxplot shown below results from the...Ch. 3.3 - Boxplot Comparison Refer to the boxplots shown...Ch. 3.3 - z Scores If your score on your next statistics...Ch. 3.3 - z Scores. In Exercises 5-8, express all z scores...Ch. 3.3 - z Scores. In Exercises 5-8, express all z scores...Ch. 3.3 - Prob. 7BSCCh. 3.3 - z Scores. In Exercises 5-8, express all z scores...Ch. 3.3 - Significant Values. In Exercises 9-12, consider a...Ch. 3.3 - Prob. 10BSCCh. 3.3 - Prob. 11BSCCh. 3.3 - Prob. 12BSCCh. 3.3 - Comparing Values. In Exercises 13-16, use z scores...Ch. 3.3 - Comparing Values. In Exercises 13-16, use z scores...Ch. 3.3 - Prob. 15BSCCh. 3.3 - Prob. 16BSCCh. 3.3 - Prob. 17BSCCh. 3.3 - Prob. 18BSCCh. 3.3 - Percentiles. In Exercises 1720, use the following...Ch. 3.3 - Prob. 20BSCCh. 3.3 - Prob. 21BSCCh. 3.3 - In Exercises 2128, use the same list of Sprint...Ch. 3.3 - In Exercises 2128, use the same list of Sprint...Ch. 3.3 - Prob. 24BSCCh. 3.3 - Prob. 25BSCCh. 3.3 - Prob. 26BSCCh. 3.3 - Prob. 27BSCCh. 3.3 - Prob. 28BSCCh. 3.3 - Boxplots. In Exercises 2932, use the given data to...Ch. 3.3 - Boxplots. In Exercises 2932, use the given data to...Ch. 3.3 - Prob. 31BSCCh. 3.3 - Prob. 32BSCCh. 3.3 - Boxplots from Large Data Sets in Appendix B. In...Ch. 3.3 - Prob. 34BSCCh. 3.3 - Boxplots from Large Data Sets in Appendix B. In...Ch. 3.3 - Prob. 36BSCCh. 3.3 - Prob. 37BBCh. 3 - Prob. 1CQQCh. 3 - Sleep Median What is the median of the sample...Ch. 3 - Prob. 3CQQCh. 3 - Prob. 4CQQCh. 3 - Prob. 5CQQCh. 3 - Prob. 6CQQCh. 3 - Prob. 7CQQCh. 3 - Prob. 8CQQCh. 3 - Prob. 9CQQCh. 3 - Prob. 10CQQCh. 3 - Prob. 1RECh. 3 - Prob. 2RECh. 3 - Prob. 3RECh. 3 - Prob. 4RECh. 3 - Prob. 5RECh. 3 - Prob. 6RECh. 3 - Prob. 7RECh. 3 - Prob. 8RECh. 3 - Prob. 1CRECh. 3 - Prob. 2CRECh. 3 - Prob. 3CRECh. 3 - Prob. 4CRECh. 3 - Prob. 5CRECh. 3 - Normal Distribution Examine the distribution shown...Ch. 3 - Words Spoken by Men and Women Refer to Data Set 24...Ch. 3 - Prob. 1FDD
Knowledge Booster


Learn more about
Need a deep-dive on the concept behind this application? Look no further. Learn more about this topic, statistics and related others by exploring similar questions and additional content below.Similar questions
- An electronics company manufactures batches of n circuit boards. Before a batch is approved for shipment, m boards are randomly selected from the batch and tested. The batch is rejected if more than d boards in the sample are found to be faulty. a) A batch actually contains six faulty circuit boards. Find the probability that the batch is rejected when n = 20, m = 5, and d = 1. b) A batch actually contains nine faulty circuit boards. Find the probability that the batch is rejected when n = 30, m = 10, and d = 1.arrow_forwardTwenty-eight applicants interested in working for the Food Stamp program took an examination designed to measure their aptitude for social work. A stem-and-leaf plot of the 28 scores appears below, where the first column is the count per branch, the second column is the stem value, and the remaining digits are the leaves. a) List all the values. Count 1 Stems Leaves 4 6 1 4 6 567 9 3688 026799 9 8 145667788 7 9 1234788 b) Calculate the first quartile (Q1) and the third Quartile (Q3). c) Calculate the interquartile range. d) Construct a boxplot for this data.arrow_forwardPam, Rob and Sam get a cake that is one-third chocolate, one-third vanilla, and one-third strawberry as shown below. They wish to fairly divide the cake using the lone chooser method. Pam likes strawberry twice as much as chocolate or vanilla. Rob only likes chocolate. Sam, the chooser, likes vanilla and strawberry twice as much as chocolate. In the first division, Pam cuts the strawberry piece off and lets Rob choose his favorite piece. Based on that, Rob chooses the chocolate and vanilla parts. Note: All cuts made to the cake shown below are vertical.Which is a second division that Rob would make of his share of the cake?arrow_forward
- Three players (one divider and two choosers) are going to divide a cake fairly using the lone divider method. The divider cuts the cake into three slices (s1, s2, and s3). If the choosers' declarations are Chooser 1: {s1 , s2} and Chooser 2: {s2 , s3}. Using the lone-divider method, how many different fair divisions of this cake are possible?arrow_forwardTheorem 2.6 (The Minkowski inequality) Let p≥1. Suppose that X and Y are random variables, such that E|X|P <∞ and E|Y P <00. Then X+YpX+Yparrow_forwardTheorem 1.2 (1) Suppose that P(|X|≤b) = 1 for some b > 0, that EX = 0, and set Var X = 0². Then, for 0 0, P(X > x) ≤e-x+1²² P(|X|>x) ≤2e-1x+1²² (ii) Let X1, X2...., Xn be independent random variables with mean 0, suppose that P(X ≤b) = 1 for all k, and set oσ = Var X. Then, for x > 0. and 0x) ≤2 exp Σ k=1 (iii) If, in addition, X1, X2, X, are identically distributed, then P(S|x) ≤2 expl-tx+nt²o).arrow_forward
- Theorem 5.1 (Jensen's inequality) state without proof the Jensen's Ineg. Let X be a random variable, g a convex function, and suppose that X and g(X) are integrable. Then g(EX) < Eg(X).arrow_forwardCan social media mistakes hurt your chances of finding a job? According to a survey of 1,000 hiring managers across many different industries, 76% claim that they use social media sites to research prospective candidates for any job. Calculate the probabilities of the following events. (Round your answers to three decimal places.) answer parts a-c. a) Out of 30 job listings, at least 19 will conduct social media screening. b) Out of 30 job listings, fewer than 17 will conduct social media screening. c) Out of 30 job listings, exactly between 19 and 22 (including 19 and 22) will conduct social media screening. show all steps for probabilities please. answer parts a-c.arrow_forwardQuestion: we know that for rt. (x+ys s ا. 13. rs. and my so using this, show that it vye and EIXI, EIYO This : E (IX + Y) ≤2" (EIX (" + Ely!")arrow_forward
- Theorem 2.4 (The Hölder inequality) Let p+q=1. If E|X|P < ∞ and E|Y| < ∞, then . |EXY ≤ E|XY|||X|| ||||qarrow_forwardTheorem 7.6 (Etemadi's inequality) Let X1, X2, X, be independent random variables. Then, for all x > 0, P(max |S|>3x) ≤3 max P(S| > x). Isk≤narrow_forwardTheorem 7.2 Suppose that E X = 0 for all k, that Var X = 0} x) ≤ 2P(S>x 1≤k≤n S√2), -S√2). P(max Sk>x) ≤ 2P(|S|>x- 1arrow_forwardarrow_back_iosSEE MORE QUESTIONSarrow_forward_ios
Recommended textbooks for you
 Holt Mcdougal Larson Pre-algebra: Student Edition...AlgebraISBN:9780547587776Author:HOLT MCDOUGALPublisher:HOLT MCDOUGAL
 Glencoe Algebra 1, Student Edition, 9780079039897...AlgebraISBN:9780079039897Author:CarterPublisher:McGraw Hill
 Functions and Change: A Modeling Approach to Coll...AlgebraISBN:9781337111348Author:Bruce Crauder, Benny Evans, Alan NoellPublisher:Cengage Learning
 Big Ideas Math A Bridge To Success Algebra 1: Stu...AlgebraISBN:9781680331141Author:HOUGHTON MIFFLIN HARCOURTPublisher:Houghton Mifflin Harcourt
Holt Mcdougal Larson Pre-algebra: Student Edition...
Algebra
ISBN:9780547587776
Author:HOLT MCDOUGAL
Publisher:HOLT MCDOUGAL
Glencoe Algebra 1, Student Edition, 9780079039897...
Algebra
ISBN:9780079039897
Author:Carter
Publisher:McGraw Hill
Functions and Change: A Modeling Approach to Coll...
Algebra
ISBN:9781337111348
Author:Bruce Crauder, Benny Evans, Alan Noell
Publisher:Cengage Learning
Big Ideas Math A Bridge To Success Algebra 1: Stu...
Algebra
ISBN:9781680331141
Author:HOUGHTON MIFFLIN HARCOURT
Publisher:Houghton Mifflin Harcourt
The Shape of Data: Distributions: Crash Course Statistics #7; Author: CrashCourse;https://www.youtube.com/watch?v=bPFNxD3Yg6U;License: Standard YouTube License, CC-BY
Shape, Center, and Spread - Module 20.2 (Part 1); Author: Mrmathblog;https://www.youtube.com/watch?v=COaid7O_Gag;License: Standard YouTube License, CC-BY
Shape, Center and Spread; Author: Emily Murdock;https://www.youtube.com/watch?v=_YyW0DSCzpM;License: Standard Youtube License