
a.
To identify: The population contrast which expresses this comparison and null and alternative hypotheses in term of this contrast.
a.
Answer to Problem 30.31E
Answer:
The population contrast that expresses the comparison is:
Null Hypothesis:
Alternative hypotheses:
Explanation of Solution
Explanation:
Given info:
The researcher hypothesized that the healing is fastest under natural condition if the population
Justification:
Population contrast:
The population contrast is a combination of the means
The sum of numerical coefficient is 0,
The contrast of the mean healing rate for the natural field of the newts (1.00 group) with the non-natural field of the newts (0.00, 0.5, 1.25 and 1.50 group). The sample contrast is written as shown below,
The sum of the numerical coefficients is
The null hypothesis is a statement of equality. It represents that there is no significant difference between the groups or variables.
Null Hypothesis:
It means there is mean healing rate for natural electrical field is equal to the combined mean of the other four groups or there is no significant difference between the healing rate of natural electrical field and non-natural electrical field.
Alternative hypotheses:
It means there is mean healing rate for natural electrical field is greater than the combined mean of the other four groups or the natural healing rate is fastest.
Therefore, the sample contrast expresses this comparison is:
The null and alternative hypothesis are:
Null Hypothesis:
Alternative hypotheses:
b.
To test: The conclusion using t statistic test.
b.
Answer to Problem 30.31E
Answer:
Explanation of Solution
Explanation:
Calculation:
The researchers conclude that the healing is fastest under natural condition if the population mean for the group 1 is larger than the average of the population means for the other four groups. The effect of electrical Field on healing rate in newts is show in the given table.
| Group | Diff | Group | Diff | Group | Diff | Group | Diff | Group | Diff |
| 0 |
| 0.5 |
| 1 |
| 1.25 | 1 | 1.5 |
|
| 0 |
| 0.5 | 10 | 1 | 15 | 1.25 | 8 | 1.5 |
|
| 0 |
| 0.5 | 3 | 1 |
| 1.25 |
| 1.5 |
|
| 0 |
| 0.5 |
| 1 |
| 1.25 | 14 | 1.5 |
|
| 0 |
| 0.5 |
| 1 |
| 1.25 |
| 1.5 |
|
| 0 | 6 | 0.5 | 4 | 1 |
| 1.25 |
| 1.5 |
|
| 0 |
| 0.5 |
| 1 | 5 | 1.25 | 11 | 1.5 |
|
| 0 |
| 0.5 |
| 1 |
| 1.25 | 8 | 1.5 |
|
| 0 | 13 | 0.5 |
| 1 |
| 1.25 | 11 | 1.5 |
|
| 0 |
| 0.5 |
| 1 |
| 1.25 |
| 1.5 | 2 |
| 0 |
| 0.5 |
| 1 | 5 | 1.25 | 7 | 1.5 | 10 |
| 0 |
| 0.5 |
| 1 | 11 | 1.25 |
| 1.5 |
|
| 0.5 |
| 1 | 10 | 1.25 | 0 | 1.5 |
| ||
| 0.5 |
| 1 | 3 | 1.25 | 5 | 1.5 | 2 | ||
| 1 | 6 | 1.25 |
| 1.5 |
| ||||
| 1 |
| ||||||||
| 1 | 13 | ||||||||
| 1 |
|
Software procedure:
Step by step procedure to obtain ANOVA using the MINITAB software:
Choose Stat > ANOVA > One-Way.
In Response, select the column of Diff.
In Factor, select the column of Group.
Click OK.
Output using the MINITAB software is given below,
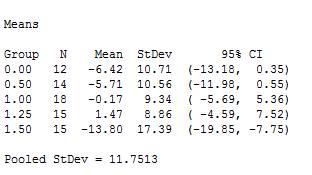
From output it is noticed that the mean of group 0.00 is
The sample contrast is written as shown below,
Substitute
The sample contrast is 5.945.
The formula for standard error of the sample contrast is given below,
From Fig (1), it is noticed that the value of pooled standard deviation is approximately 11.75.
Substitute 11.75 for
Further solve the above equation.
The formula for t test statistic is,
Thus,
Decision rule:
Reject
Critical value:
The value of t at 5% level of significance and 73 degree of freedom is approximately 1.66. Thus,
Since
c.
To explain: The reason it is not legitimate to contrast the average for the 1 and 1.25 groups with the average for the other three groups.
c.
Explanation of Solution
Explanation:
Justification:
From part (b), it is noticed that the mean of group 0.00 is
From the above information it is noticed that the mean of groups 1.00 and 1.25 is higher that the other three groups. So, it is tempting to contrast the average for the 1 and 1.25 groups with the average for the other three groups.
However, it is not legitimate because researcher hypothesized that the healing is fastest under natural condition if the population mean for the group 1 is larger than the average of the population means for the other four groups.
Therefore, the contrast the average for the 1 and 1.25 groups with the average for the other three groups is tempting but it is not legitimate because according to the researcher the mean of group 1.00 is better than the combined mean of the others, which is the hypothesis of interest. The contrast would not serve the interest of the researcher’s hypothesis.
Want to see more full solutions like this?
Chapter 30 Solutions
Loose-leaf Version for The Basic Practice of Statistics 7e & LaunchPad (Twelve Month Access)

- appropriate probabilities. 19 Using the data from Table 17-1, are gender and political party independent for this group? nis cow sib signia si Falows grillor le pussarrow_forward11 Using the same toddler data, describe the toddlers with marginal probabilities only. BAY bit of benoliesmas (89 abje' jook stages of te cojota ing ou an out of to cojota ovig ber el ba 3+4=029arrow_forward21 Using the data from the table in Question 1, does the dominant hand differ for male toddlers versus female toddlers? (In other words, are these two events dependent?)arrow_forward
- op In a two-way table with variables A and B, does P(A|B) + P(A|B) = 1? பே 69 6 work as m 3 atavs ow to portabagabat sot gaisarrow_forwardIn a two-way table with variables A and B, does P(A|B)+P(A|B)=1? dsins/Ispino936) 1 durab ALED a to gilidadost Earrow_forwardpreference are dependent (you even have to look at the males). Using the bumper sticker data in the first example problem in this chapter, are car age and number of bumper stickers related (In other words, are these two events dependent?) d insbusqabni oss agit ads bms gliw woy tadi validadong ada 15W wex s m ad ow MP gliw Boy 1st yilidadong at al terW .d Shsed smo viaxe 5X9 of pe 012 from 12 or to HOM qose Aunt swam to prepants M&arrow_forward
- 23 வ dous biops Which marginal probabilities that you find in a two-way table should sum to 1? 著arrow_forwardUsing the toddler data from the table in Question 1 and appropriate probability notation, do the following: a. Compare the right-handed female and male toddlers in the sample, using condi- tional probabilities (only). b. Compare the right-handed toddlers asid in the sample, using conditional probabilities (only).dependent abni sis & bas bax bensqged snavs med) galworl andarrow_forwardUsing the toddler data from the table in Question 1 and appropriate probability notation, identify and calculate the following: a. What percentage of the male toddlers are right-handed? te b. What percentage of the female toddlers are right-handed? c. What percentage of the right-handed toddlers are male? d. What percentage of the right-handed toddlers are female?arrow_forward
- 10 Using the toddler data from the table in Question 1 and the appropriate probability Tonotation, identify and calculate ther s following: a. What percentage of the toddlers are right-handed? b. now to What percentage of the toddlers are female? female? da boit vom wo c. What proportion of the toddlers are left-handed? d. What's the chance of finding a male toddler from the sample? [10arrow_forward9 Using the car data from the bumper sticker table earlier in this chapter and the appro- priate probability notation, identify and calculate the following: a. What percentage of the cars are newer cars? b. What's the proportion of older cars? c. What percentage of the cars have a lot of bumper stickers? d. What's the probability that a car doesn't have a lot of bumper stickers?arrow_forwardSuppose that you roll a single die two times, and the trials are independent. What is the chance of rolling two 1s?arrow_forward
 MATLAB: An Introduction with ApplicationsStatisticsISBN:9781119256830Author:Amos GilatPublisher:John Wiley & Sons Inc
 Probability and Statistics for Engineering and th...StatisticsISBN:9781305251809Author:Jay L. DevorePublisher:Cengage Learning
 Statistics for The Behavioral Sciences (MindTap C...StatisticsISBN:9781305504912Author:Frederick J Gravetter, Larry B. WallnauPublisher:Cengage Learning
 Elementary Statistics: Picturing the World (7th E...StatisticsISBN:9780134683416Author:Ron Larson, Betsy FarberPublisher:PEARSON
 The Basic Practice of StatisticsStatisticsISBN:9781319042578Author:David S. Moore, William I. Notz, Michael A. FlignerPublisher:W. H. Freeman
 Introduction to the Practice of StatisticsStatisticsISBN:9781319013387Author:David S. Moore, George P. McCabe, Bruce A. CraigPublisher:W. H. Freeman