
a.
The confidence interval that capture the true differences between the pairs of population means.
a.
Answer to Problem 30.28E
All the confidence interval captures the true difference in between the length of pairs of population means of three varieties of the tropical flower Heliconia.
Explanation of Solution
Given info:
The confidence intervals are given below;
Calculation:
Consider the first confidence interval that is given as;
The null hypothesis is,
The alternative hypothesis is,
A 95% confidence interval whose lower limit is 6.752 and the upper limit is 9.021 for the
Consider the second confidence interval that is given as;
The null hypothesis is,
The alternative hypothesis is,
A 95% confidence interval whose lower limit is 10.165 and the upper limit is 12.670 for the mean length of the bihai flowers
Consider the third confidence interval that is given as;
The null hypothesis is,
The alternative hypothesis is,
A 95% confidence interval whose lower limit is 2.375 and the upper limit is 4.688 for the mean length of the bihai flowers
b.
The short summary of the result of the ANOVA which include the multiple comparisons.
b.
Answer to Problem 30.28E
There are highly significance difference in between the mean length of the flowers varieties fertilized by different Hummingbird species should have different distribution of length. The one-way ANOVA is used by comparing the mean length of the population. But the characteristic of the data that makes ANOVA is risky is lack of normality condition or groups do not follow
Explanation of Solution
Given info:
The confidence intervals are given below;
6.752 to 9.021 for
Software procedure:
Step by step procedure to obtain one way ANOVA using the MINITAB software:
- Choose Stat > ANOVA > One way.
- In Response, select the column of Length.
- In Factor, select the column of Variety.
- Choose > Comparisons > Tukey in comparison procedures assuming equal variances and tick on Test in Results and then OK.
- Click OK.
The Minitab One-way ANOVA output is,
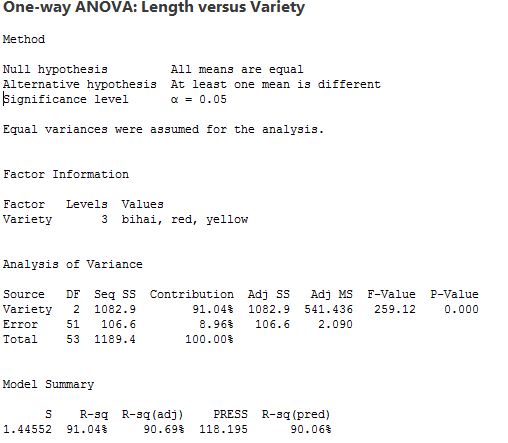
Fig (1)
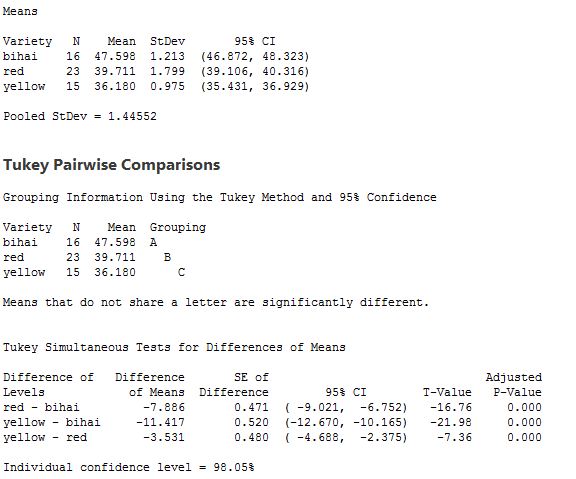
Fig (2)
The means of varieties of the tropical flower Heliconia are obtained as:
The mean for bihai is 47.598, for red is 39.711 and yellow is 36.180 and hypothesis is stated as:
The null hypothesis is,
And alternative hypothesis is,
From the analysis of variance table, F-value is 259.12 and their P-value is 0.000. This shows that null hypothesis is rejected because P-value is 0.000 which is very less 5% level of significance.
So, there is highly difference in the mean length of the flowers varieties fertilized by different Hummingbird species should have different distribution of length.
For the pair wise comparisons,
From the Tukey' simultaneous tests for difference of means shows that the difference in between
Similarly for
The rule of thumb is satisfied because the standard deviation of largest group
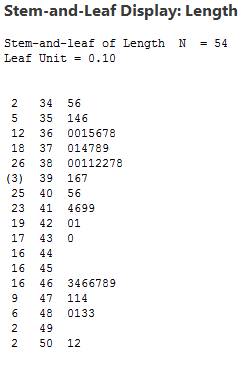
Fig (3)
The one-way ANOVA is used by comparing the mean length of the population. But the characteristic of the data that makes ANOVA is risky is lack of normality condition or groups do not follow normal distribution.
Want to see more full solutions like this?
Chapter 30 Solutions
Loose-leaf Version for The Basic Practice of Statistics 7e & LaunchPad (Twelve Month Access)

- You are provided with data that includes all 50 states of the United States. Your task is to draw a sample of: 20 States using Random Sampling (2 points: 1 for random number generation; 1 for random sample) 10 States using Systematic Sampling (4 points: 1 for random numbers generation; 1 for generating random sample different from the previous answer; 1 for correct K value calculation table; 1 for correct sample drawn by using systematic sampling) (For systematic sampling, do not use the original data directly. Instead, first randomize the data, and then use the randomized dataset to draw your sample. Furthermore, do not use the random list previously generated, instead, generate a new random sample for this part. For more details, please see the snapshot provided at the end.) You are provided with data that includes all 50 states of the United States. Your task is to draw a sample of: o 20 States using Random Sampling (2 points: 1 for random number generation; 1 for random sample) o…arrow_forwardCourse Home ✓ Do Homework - Practice Ques ✓ My Uploads | bartleby + mylab.pearson.com/Student/PlayerHomework.aspx?homeworkId=688589738&questionId=5&flushed=false&cid=8110079¢erwin=yes Online SP 2025 STA 2023-009 Yin = Homework: Practice Questions Exam 3 Question list * Question 3 * Question 4 ○ Question 5 K Concluir atualização: Ava Pearl 04/02/25 9:28 AM HW Score: 71.11%, 12.09 of 17 points ○ Points: 0 of 1 Save Listed in the accompanying table are weights (kg) of randomly selected U.S. Army male personnel measured in 1988 (from "ANSUR I 1988") and different weights (kg) of randomly selected U.S. Army male personnel measured in 2012 (from "ANSUR II 2012"). Assume that the two samples are independent simple random samples selected from normally distributed populations. Do not assume that the population standard deviations are equal. Complete parts (a) and (b). Click the icon to view the ANSUR data. a. Use a 0.05 significance level to test the claim that the mean weight of the 1988…arrow_forwardsolving problem 1arrow_forward
- select bmw stock. you can assume the price of the stockarrow_forwardThis problem is based on the fundamental option pricing formula for the continuous-time model developed in class, namely the value at time 0 of an option with maturity T and payoff F is given by: We consider the two options below: Fo= -rT = e Eq[F]. 1 A. An option with which you must buy a share of stock at expiration T = 1 for strike price K = So. B. An option with which you must buy a share of stock at expiration T = 1 for strike price K given by T K = T St dt. (Note that both options can have negative payoffs.) We use the continuous-time Black- Scholes model to price these options. Assume that the interest rate on the money market is r. (a) Using the fundamental option pricing formula, find the price of option A. (Hint: use the martingale properties developed in the lectures for the stock price process in order to calculate the expectations.) (b) Using the fundamental option pricing formula, find the price of option B. (c) Assuming the interest rate is very small (r ~0), use Taylor…arrow_forwardDiscuss and explain in the picturearrow_forward
- Bob and Teresa each collect their own samples to test the same hypothesis. Bob’s p-value turns out to be 0.05, and Teresa’s turns out to be 0.01. Why don’t Bob and Teresa get the same p-values? Who has stronger evidence against the null hypothesis: Bob or Teresa?arrow_forwardReview a classmate's Main Post. 1. State if you agree or disagree with the choices made for additional analysis that can be done beyond the frequency table. 2. Choose a measure of central tendency (mean, median, mode) that you would like to compute with the data beyond the frequency table. Complete either a or b below. a. Explain how that analysis can help you understand the data better. b. If you are currently unable to do that analysis, what do you think you could do to make it possible? If you do not think you can do anything, explain why it is not possible.arrow_forward0|0|0|0 - Consider the time series X₁ and Y₁ = (I – B)² (I – B³)Xt. What transformations were performed on Xt to obtain Yt? seasonal difference of order 2 simple difference of order 5 seasonal difference of order 1 seasonal difference of order 5 simple difference of order 2arrow_forward
- Calculate the 90% confidence interval for the population mean difference using the data in the attached image. I need to see where I went wrong.arrow_forwardMicrosoft Excel snapshot for random sampling: Also note the formula used for the last column 02 x✓ fx =INDEX(5852:58551, RANK(C2, $C$2:$C$51)) A B 1 No. States 2 1 ALABAMA Rand No. 0.925957526 3 2 ALASKA 0.372999976 4 3 ARIZONA 0.941323044 5 4 ARKANSAS 0.071266381 Random Sample CALIFORNIA NORTH CAROLINA ARKANSAS WASHINGTON G7 Microsoft Excel snapshot for systematic sampling: xfx INDEX(SD52:50551, F7) A B E F G 1 No. States Rand No. Random Sample population 50 2 1 ALABAMA 0.5296685 NEW HAMPSHIRE sample 10 3 2 ALASKA 0.4493186 OKLAHOMA k 5 4 3 ARIZONA 0.707914 KANSAS 5 4 ARKANSAS 0.4831379 NORTH DAKOTA 6 5 CALIFORNIA 0.7277162 INDIANA Random Sample Sample Name 7 6 COLORADO 0.5865002 MISSISSIPPI 8 7:ONNECTICU 0.7640596 ILLINOIS 9 8 DELAWARE 0.5783029 MISSOURI 525 10 15 INDIANA MARYLAND COLORADOarrow_forwardSuppose the Internal Revenue Service reported that the mean tax refund for the year 2022 was $3401. Assume the standard deviation is $82.5 and that the amounts refunded follow a normal probability distribution. Solve the following three parts? (For the answer to question 14, 15, and 16, start with making a bell curve. Identify on the bell curve where is mean, X, and area(s) to be determined. 1.What percent of the refunds are more than $3,500? 2. What percent of the refunds are more than $3500 but less than $3579? 3. What percent of the refunds are more than $3325 but less than $3579?arrow_forward
 MATLAB: An Introduction with ApplicationsStatisticsISBN:9781119256830Author:Amos GilatPublisher:John Wiley & Sons Inc
 Probability and Statistics for Engineering and th...StatisticsISBN:9781305251809Author:Jay L. DevorePublisher:Cengage Learning
 Statistics for The Behavioral Sciences (MindTap C...StatisticsISBN:9781305504912Author:Frederick J Gravetter, Larry B. WallnauPublisher:Cengage Learning
 Elementary Statistics: Picturing the World (7th E...StatisticsISBN:9780134683416Author:Ron Larson, Betsy FarberPublisher:PEARSON
 The Basic Practice of StatisticsStatisticsISBN:9781319042578Author:David S. Moore, William I. Notz, Michael A. FlignerPublisher:W. H. Freeman
 Introduction to the Practice of StatisticsStatisticsISBN:9781319013387Author:David S. Moore, George P. McCabe, Bruce A. CraigPublisher:W. H. Freeman