Biological Science (6th Edition)
6th Edition
ISBN: 9780321976499
Author: Scott Freeman, Kim Quillin, Lizabeth Allison, Michael Black, Emily Taylor, Greg Podgorski, Jeff Carmichael
Publisher: PEARSON
expand_more
expand_more
format_list_bulleted
Textbook Question
Chapter 30, Problem 15PIAT
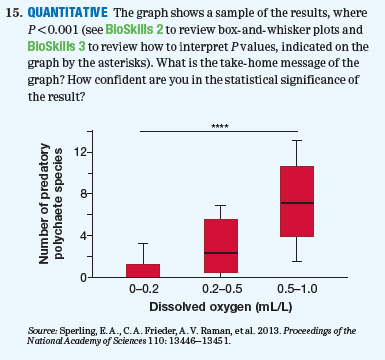
QUANTITATIVE The graph shows a sample of the results, where P<0.001 (see BioSkllls 2 to review box-and-whisker plots and BioSkills 3 to review how to interpret P values, indicated on the graph by the asterisks). What is the take-home message of the graph? How confident are you in the statistical significance of the result?

Expert Solution & Answer
Want to see the full answer?
Check out a sample textbook solution
Students have asked these similar questions
Molecular Biology
A-C components of the question are corresponding to attached image labeled 1.
D component of the question is corresponding to attached image labeled 2.
For a eukaryotic mRNA, the sequences is as follows where AUGrepresents the start codon, the yellow is the Kozak sequence and (XXX) just represents any codonfor an amino acid (no stop codons here). G-cap and polyA tail are not shown
A. How long is the peptide produced?B. What is the function (a sentence) of the UAA highlighted in blue?C. If the sequence highlighted in blue were changed from UAA to UAG, how would that affecttranslation?
D. (1) The sequence highlighted in yellow above is moved to a new position indicated below. Howwould that affect translation? (2) How long would be the protein produced from this new mRNA?
Thank you
Molecular Biology
Question
Explain why the cell doesn’t need 61 tRNAs (one for each codon).
Please help. Thank you
Molecular Biology
You discover a disease causing mutation (indicated by the arrow) that alters splicing of its mRNA. This mutation (a base substitution in the splicing sequence) eliminates a 3’ splice site resulting in the inclusion of the second intron (I2) in the final mRNA. We are going to pretend that this intron is short having only 15 nucleotides (most introns are much longer so this is just to make things simple) with the following sequence shown below in bold. The ( ) indicate the reading frames in the exons; the included intron 2 sequences are in bold.
A. Would you expected this change to be harmful? ExplainB. If you were to do gene therapy to fix this problem, briefly explain what type of gene therapy youwould use to correct this.
Please help. Thank you
Chapter 30 Solutions
Biological Science (6th Edition)
Ch. 30 - 1. What synapomorphy (shared, derived trait)...Ch. 30 - 2. In a tube-within-a-tube body plan, what is the...Ch. 30 - True or false? Many new major animal body plans...Ch. 30 - Prob. 4TYKCh. 30 - 5. Why is it ecologically significant that animals...Ch. 30 - Prob. 6TYUCh. 30 - 7. CAUTION Evaluate this statement: Animals...Ch. 30 - 8. Which of the following is an example of...Ch. 30 - Suppose that a gene originally identified in...Ch. 30 - Some sea anemones can produce large colonies by...
Ch. 30 - Why did animal phyla appear so suddenly during the...Ch. 30 - Sperling and Knoll’s approach was to compare the...Ch. 30 - 13. Which of the following traits would help the...Ch. 30 - 14. PROCESS OF SCIENCE The researchers analyzed...Ch. 30 - QUANTITATIVE The graph shows a sample of the...Ch. 30 - Sponges lived in low-oxygen oceans before the...
Knowledge Booster
Learn more about
Need a deep-dive on the concept behind this application? Look no further. Learn more about this topic, biology and related others by exploring similar questions and additional content below.Similar questions
- Molecular Biology Question Please help. Thank you Explain what is meant by the term “defective virus.” Explain how a defective virus is able to replicate.arrow_forwardMolecular Biology Explain why changing the codon GGG to GGA should not be harmful. Please help . Thank youarrow_forwardStage Percent Time in Hours Interphase .60 14.4 Prophase .20 4.8 Metaphase .10 2.4 Anaphase .06 1.44 Telophase .03 .72 Cytukinesis .01 .24 Can you summarize the results in the chart and explain which phases are faster and why the slower ones are slow?arrow_forward
- Can you circle a cell in the different stages of mitosis? 1.prophase 2.metaphase 3.anaphase 4.telophase 5.cytokinesisarrow_forwardWhich microbe does not live part of its lifecycle outside humans? A. Toxoplasma gondii B. Cytomegalovirus C. Francisella tularensis D. Plasmodium falciparum explain your answer thoroughly.arrow_forwardSelect all of the following that the ablation (knockout) or ectopoic expression (gain of function) of Hox can contribute to. Another set of wings in the fruit fly, duplication of fingernails, ectopic ears in mice, excess feathers in duck/quail chimeras, and homeosis of segment 2 to jaw in Hox2a mutantsarrow_forward
- Select all of the following that changes in the MC1R gene can lead to: Changes in spots/stripes in lizards, changes in coat coloration in mice, ectopic ear formation in Siberian hamsters, and red hair in humansarrow_forwardPleiotropic genes are genes that (blank) Cause a swapping of organs/structures, are the result of duplicated sets of chromosomes, never produce protein products, and have more than one purpose/functionarrow_forwardA loss of function mutation in Pitx1 enhancers can cause (blank) Removal of Pitx1 exons and growth of ectopic hindlimbs, growth of extra ectopic forelimbs, loss of forelimb specification and development, and loss of hindlimb specification and developmentarrow_forward
- Hox1a most likely contributes to (blank) patterning in the developing embryo? Ventral, posterior, limb or anteriorarrow_forwardSelect all of the following that can help establish Hox gene expression boundaries (things that affect Hox and not things that Hox affects). Retinoic acid, anterior/posterior axis, fibroblast growth factors, vagal neural crest, and enhancersarrow_forwardEctopic expression of Hox often results in (blank) phenotypes. (Blank) transformations are characterized by the replacement of one body part/structure with another. Hoxeotic, homealoneotic, joexotic, or homeoticarrow_forward
arrow_back_ios
SEE MORE QUESTIONS
arrow_forward_ios
Recommended textbooks for you
- Case Studies In Health Information ManagementBiologyISBN:9781337676908Author:SCHNERINGPublisher:Cengage
 Principles Of Radiographic Imaging: An Art And A ...Health & NutritionISBN:9781337711067Author:Richard R. Carlton, Arlene M. Adler, Vesna BalacPublisher:Cengage LearningHealth Safety And Nutrition F/Young ChildHealth & NutritionISBN:9781305144767Author:MAROTZPublisher:Cengage


Case Studies In Health Information Management
Biology
ISBN:9781337676908
Author:SCHNERING
Publisher:Cengage


Principles Of Radiographic Imaging: An Art And A ...
Health & Nutrition
ISBN:9781337711067
Author:Richard R. Carlton, Arlene M. Adler, Vesna Balac
Publisher:Cengage Learning

Health Safety And Nutrition F/Young Child
Health & Nutrition
ISBN:9781305144767
Author:MAROTZ
Publisher:Cengage

DNA Use In Forensic Science; Author: DeBacco University;https://www.youtube.com/watch?v=2YIG3lUP-74;License: Standard YouTube License, CC-BY
Analysing forensic evidence | The Laboratory; Author: Wellcome Collection;https://www.youtube.com/watch?v=68Y-OamcTJ8;License: Standard YouTube License, CC-BY