
Subpart (a):
The production possibility frontier .
Subpart (a):
Explanation of Solution
Figure -1 illustrates production possibility frontier.
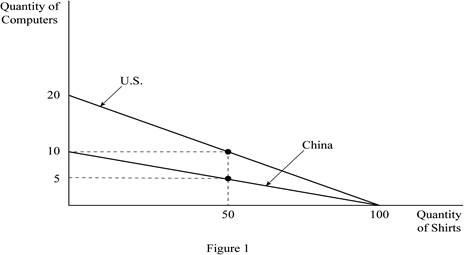
Figure 1 shows the production possibilities frontiers for the two countries; U.S. and China. In Figure 1, the horizontal axis measures the quantity of shirts produced by both the countries and the vertical axis measures the quantity of computers produced. If either worker of the two countries, that is an American or a Chinese worker devotes all his labor hours in producing shirts, each worker can produce 100 shirts in a year. Then, it is the vertical intercept of the PPF for both the American and the Chinese worker. If they devote all of their time to the production of computers, then the U.S. worker can produce 20 computers in a year, while the Chinese worker can produce only 10 computers per year. These are the horizontal intercepts of the PPF for the U.S. and the Chinese worker, respectively. Since the
Concept introduction:
Production possibility frontier (PPF): PPF is a curve depicting all maximum output possibilities for two goods, given a set of inputs consisting of resources and other factors.
Subpart (b):
Opportunity cost and price of the good.
Subpart (b):
Explanation of Solution
To determine the export pattern of shirts, the
Opportunity cost of shirts in the U.S. is calculated as,
Thus, the price of 1 shirt in the U.S. is 0.2 computers.
Opportunity cost of shirts in China is calculated as,
Thus, the price of 1 shirt in China is 0.1 computers.
Since China has a lower opportunity cost of shirts, China has a comparative advantage in its production. So, China will produce and export shirts to the U.S. in exchange for computers from the U.S. since the latter has a comparative advantage in the production of computers (5 shirts
The range of prices of shirts at which trade can occur is between 0.1 and 0.2 computers, per computer.
An example would be a price of 0.15 computers. Suppose China produced only shirts (100 shirts) and exported 50 shirts in exchange for 7.5
The United States is also benefited from this trade. Suppose American workers produced only computers (20 computers) and traded 7.5 of computers to China for 50 shirts. The U.S. would have 12.5 (20-7.5) computers and 50 shirts. Thus, the U.S. would be better off than before trade (10 computers and 50 shirts).
Concept introduction:
Production possibility frontier (PPF): PPF is a curve depicting all maximum output possibilities for two goods, given a set of inputs consisting of resources and other factors.
Opportunity cost: Opportunity cost is the cost of foregone alternative, that is, loss of an alternative when another alternative is chosen.
Comparative advantage: It refers to the ability to produce a good at a lower opportunity cost than another producer.
Subpart (c):
Opportunity cost and price of the good.
Subpart (c):
Explanation of Solution
For the calculation of price, the calculation of opportunity cost is required.
Opportunity cost of a computer in the U.S. is calculated as,
Thus, the price of 1 computer in the U.S. is 5 shirts.
Opportunity cost of a computer in China is calculated as,
Thus, the price of 1 computer in China is 10 shirts.
The range of prices of computers at which trade can occur is between 5 and 10 shirts per computer. This is because, at a price lower than 5 shirts, the U.S. will choose to produce its own shirts and will be unwilling to export computers, as the opportunity cost of a shirt for the U.S. is 0.2
Concept introduction:
Production possibility frontier (PPF): PPF is a curve depicting all maximum output possibilities for two goods, given a set of inputs consisting of resources and other factors.
Opportunity cost: Opportunity cost is the cost of foregone alternative, that is, loss of an alternative when another alternative is chosen.
Comparative advantage: It refers to the ability to produce a good at a lower opportunity cost than another producer.
Subpart (d):
Gains from the trade.
Subpart (d):
Explanation of Solution
Concept introduction:
Specialization: Specialization refers to allocate the work according to their efficiency. If an individual, company or country has produced a good at lower opportunity cost, then that particular individual, company or country should produce those goods.
Trade: The trade refers to the exchange of capital, goods, and services across different countries.
Want to see more full solutions like this?
Chapter 3 Solutions
PRICIPLES OF MACROECONOMICS

- In a paragraph, no bullet, points please answer the question and follow the instructions. Give only the solution: Use the Feynman technique throughout. Assume that you’re explaining the answer to someone who doesn’t know the topic at all. 8. How does monetary policy supposedly translate into changes in AD?arrow_forwardIn a paragraph, no bullet, points please answer the question and follow the instructions. Give only the solution: Use the Feynman technique throughout. Assume that you’re explaining the answer to someone who doesn’t know the topic at all. 2. Carefully explain either Keynes’ “cookie jar” motive for holding money or the “saw-toothed model’s” motive for holding a safety stock.arrow_forwardIn a paragraph, no bullet, points please answer the question and follow the instructions. Give only the solution: Use the Feynman technique throughout. Assume that you’re explaining the answer to someone who doesn’t know the topic at all. 7.Carefully explain the Fisher equation for interest rates. What insight does it provide?arrow_forward
- In a paragraph, no bullet, points please answer the question and follow the instructions. Give only the solution: Use the Feynman technique throughout. Assume that you’re explaining the answer to someone who doesn’t know the topic at all. 3. Describe the general architecture of the Federal Reserve System.arrow_forwardIn a paragraph, no bullet, points please answer the question and follow the instructions. Give only the solution: Use the Feynman technique throughout. Assume that you’re explaining the answer to someone who doesn’t know the topic at all. 1. Define money. Carefully explain the three functions of money.arrow_forwardIn a paragraph, no bullet, points please answer the question and follow the instructions. Give only the solution: Use the Feynman technique throughout. Assume that you’re explaining the answer to someone who doesn’t know the topic at all. 5.Draw the Federal Reserve System’s Balance Sheet and briefly explain each of the main (highlighted in the PowerPoints and text) components.arrow_forward
- In a paragraph, no bullet, points please answer the question and follow the instructions. Give only the solution: Use the Feynman technique throughout. Assume that you’re explaining the answer to someone who doesn’t know the topic at all. 9. What are monetary rules? How are they carried out and what is the difference between monetary rules and discretionary behavior?arrow_forwardIn a paragraph, no bullet, points please answer the question and follow the instructions. Give only the solution: Use the Feynman technique throughout. Assume that you’re explaining the answer to someone who doesn’t know the topic at all. 4. What is interest payment on reserve balances used for? How does it work?arrow_forwardA linear programming computer package is needed. As part of the settlement for a class action lawsuit, Hoxworth Corporation must provide sufficient cash to make the following annual payments (in thousands of dollars). Year 1 2 3 4 5 6 Payment 170 195 220 265 295 440 The annual payments must be made at the beginning of each year. The judge will approve an amount that, along with earnings on its investment, will cover the annual payments. Investment of the funds will be limited to savings (at 4% annually) and government securities, at prices and rates currently quoted in The Wall Street Journal. Hoxworth wants to develop a plan for making the annual payments by investing in the following securities (par value = $1,000). Funds not invested in these securities will be placed in savings. Security Current Price Rate (%) Years to Maturity 1 $1,055 6.750 3 2 $1,000 5.125 4 Assume that interest is paid annually. The plan will be submitted to the judge and, if approved,…arrow_forward
- On the 1st of April 2018, the South African National Treasury increase the value-added tax rate from 14% to 15%. This policy change had a wide-ranging impact on society. Discuss some of the benefits and drawbacks of making use of this type of tax to generate government revenue and what we may expect in terms of its impact on inflation and GDP growth within the economy. Please use some of the economics graphs to explain some scenariosarrow_forwardEskom is South Africa’s monopoly power producer which the majority of South Africans depend on. Suppose there is extensive deregulation in the power industry. What is the impact of this deregulation on the industry? Help me on discussing the new market structure as well as the impact on supply and demand. Use the relevant diagrams.arrow_forwardDiscuss the impact of exchange rate volatility on the economy and its impact on your organisation. Make use of the relevant diagrams.arrow_forward
 Exploring EconomicsEconomicsISBN:9781544336329Author:Robert L. SextonPublisher:SAGE Publications, Inc
 Economics (MindTap Course List)EconomicsISBN:9781337617383Author:Roger A. ArnoldPublisher:Cengage Learning

 Economics Today and Tomorrow, Student EditionEconomicsISBN:9780078747663Author:McGraw-HillPublisher:Glencoe/McGraw-Hill School Pub Co
 Principles of Economics 2eEconomicsISBN:9781947172364Author:Steven A. Greenlaw; David ShapiroPublisher:OpenStax