Engineering Economy (16th Edition) - Standalone book
16th Edition
ISBN: 9780133439274
Author: William G. Sullivan, Elin M. Wicks, C. Patrick Koelling
Publisher: PEARSON
expand_more
expand_more
format_list_bulleted
Textbook Question
Chapter 3, Problem 8P
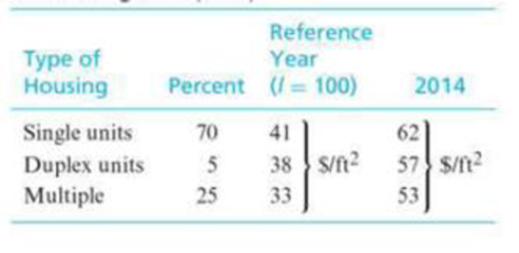
Prepare a composite (weighted) index for housing construction costs in 2014, using the following data: (3.3)

Expert Solution & Answer
Trending nowThis is a popular solution!

Students have asked these similar questions
Location should be in GWAGWALADA Abuja Nigeria
Use the Internet to do it
Using data from 1988 for houses sold in Andover, Massachusetts, from Kiel and McClain
(1995), the following equation relates housing price (price) to the distance from a recently
built garbage incinerator (dist):
=
log(price) 9.40 + 0.312 log(dist)
n = 135, R2 = 0.162.
Interpretation of the slope coefficient?
► How would our interpretation of the slope coefficient change if
distance were measured in metres instead of kilometres?
If GDP goes up by 1% and the investment component of GDPgoes up by more than 1%, how is the investment share ofGDP changing in absolute terms?▶ In economics, what else is expressed as relative percentagechanges?
Chapter 3 Solutions
Engineering Economy (16th Edition) - Standalone book
Ch. 3 - Prob. 1PCh. 3 - Prob. 2PCh. 3 - Prob. 3PCh. 3 - Prob. 4PCh. 3 - Prob. 5PCh. 3 - Prob. 6PCh. 3 - Prob. 7PCh. 3 - Prepare a composite (weighted) index for housing...Ch. 3 - Prepare a composite (weighted) index for housing...Ch. 3 - Prob. 10P
Ch. 3 - Prob. 11PCh. 3 - Prob. 12PCh. 3 - Prob. 13PCh. 3 - Prob. 14PCh. 3 - Prob. 15PCh. 3 - A biotech firm is considering abandoning its old...Ch. 3 - Prob. 17PCh. 3 - Prob. 18PCh. 3 - Prob. 19PCh. 3 - Prob. 20PCh. 3 - Prob. 21PCh. 3 - Prob. 22PCh. 3 - Prob. 23PCh. 3 - Prob. 24PCh. 3 - Prob. 25PCh. 3 - Prob. 26PCh. 3 - Prob. 28SECh. 3 - Prob. 31CSCh. 3 - Prob. 32CSCh. 3 - Prob. 36FECh. 3 - Prob. 37FECh. 3 - Prob. 38FECh. 3 - Prob. 39FECh. 3 - Prob. 40FECh. 3 - Prob. 41FE
Additional Business Textbook Solutions
Find more solutions based on key concepts
How is activity-based costing useful for pricing decisions?
Horngren's Cost Accounting: A Managerial Emphasis (16th Edition)
Real options and its types. Introduction: The net present value is the variation between present cash inflows v...
Gitman: Principl Manageri Finance_15 (15th Edition) (What's New in Finance)
1-1. Define marketing and outline the steps in the marketing process. (AASCB: Communication)
Marketing: An Introduction (13th Edition)
The flowchart for the process at the local car wash. Introduction: Flowchart: A flowchart is a visualrepresenta...
Principles of Operations Management: Sustainability and Supply Chain Management (10th Edition)
BE1-7 Indicate which statement you would examine to find each of the following items: income statement (IS), ba...
Financial Accounting: Tools for Business Decision Making, 8th Edition
Assume you are a CFO of a company that is attempting to race additional capital to finance an expansion of its ...
Financial Accounting, Student Value Edition (5th Edition)
Knowledge Booster
Learn more about
Need a deep-dive on the concept behind this application? Look no further. Learn more about this topic, economics and related others by exploring similar questions and additional content below.Similar questions
- CEO Salary and Firm SalesWe can estimate a constant elasticity model relating CEO salary to firm sales. The data set is the same one used in Example 2.3, except we now relate salary to sales. Let sales be annual firm sales, measured in millions of dollars. A constant elasticity model is[2.45]ßßlog (salary) = ß0 + ß0log (sales) + u,where ß1 is the elasticity of salary with respect to sales. This model falls under the simple regression model by defining the dependent variable to be y = log(salary) and the independent variable to be x = log1sales2. Estimating this equation by OLS gives[2.46]log (salary)^=4.822 + 0.257 (sales) n = 209, R2 = 0.211.The coefficient of log(sales) is the estimated elasticity of salary with respect to sales. It implies that a 1% increase in firm sales increases CEO salary by about 0.257%—the usual interpretation of an elasticity.arrow_forwardSolvearrow_forwardAsap please and give with explanation with each steparrow_forward
- not use ai pleaesarrow_forwardNot use ai pleasearrow_forwardB G C D E H M K Armchair For puzzles 96 and 97, use the first phylogenetic tree on the following page (Figure 2). 96) Who is the most recent common ancestor of species A and species G? 97) Who is the most recent common ancestor of species D, E, and F?arrow_forward
- Not use ai pleasearrow_forwardNot use ai pleasearrow_forwardStealth bank has deposits of $700 million. It holds reserves of $20 million and has purchased government bonds worth $350 million. The banks loans, if sold at current market value, would be worth $600 million. What is the total value of Stealth bank's assets? I believe my calculation of 1.3 billion may be incorrect May I have my work checked pleasearrow_forward
- The following graph shows the downward-sloping demand curve for Oiram-46, a monopolist producing unique magic hats. The graph also shows Oiram-46's marginal revenue curve and its average total cost curve. On the following graph, use the orange point (square symbol) to indicate the profit-maximizing quantity. Use the blue point (circle symbol) to indicate the profit-maximizing price. Use the purple point (diamond symbol) to indicate the average total cost. Use the tan rectangle (dash symbol) to show Oiram-46's total revenue and the grey rectangle (star symbol) to show its total cost. PRICE (Dollars per magic hat) 2 0 20 Marginal Cost 18 ATC 16 Profit-Maximizing Quantity 14 12 Profit-Maximizing Price MC 8 Demand 02 4 6 8 10 12 14 16 18 20 QUANTITY (Magic hats per week) Based on the graph, Oiram-46's profit is equal to 5 TOTAL SCORE: 1/4 Average Total Cost Total Revenue Total Cost Grade Step 2 (to complete this step and unlock the next step)arrow_forwardExplain information regarding the effective interest rates being charged and how much higher the rent-to-own stores’ cash price exceeded the price of the identical item at a reputable retail outlet.arrow_forwardHow can Rent-to-own industries avoid the restrictions on interest rates? Explain.arrow_forward
arrow_back_ios
SEE MORE QUESTIONS
arrow_forward_ios
Recommended textbooks for you
 Managerial Economics: Applications, Strategies an...EconomicsISBN:9781305506381Author:James R. McGuigan, R. Charles Moyer, Frederick H.deB. HarrisPublisher:Cengage Learning
 Managerial Economics: A Problem Solving ApproachEconomicsISBN:9781337106665Author:Luke M. Froeb, Brian T. McCann, Michael R. Ward, Mike ShorPublisher:Cengage Learning


 Economics (MindTap Course List)EconomicsISBN:9781337617383Author:Roger A. ArnoldPublisher:Cengage Learning

Managerial Economics: Applications, Strategies an...
Economics
ISBN:9781305506381
Author:James R. McGuigan, R. Charles Moyer, Frederick H.deB. Harris
Publisher:Cengage Learning

Managerial Economics: A Problem Solving Approach
Economics
ISBN:9781337106665
Author:Luke M. Froeb, Brian T. McCann, Michael R. Ward, Mike Shor
Publisher:Cengage Learning


Economics (MindTap Course List)
Economics
ISBN:9781337617383
Author:Roger A. Arnold
Publisher:Cengage Learning
Difference between Renewable and Nonrenewable Resources; Author: MooMooMath and Science;https://www.youtube.com/watch?v=PLBK1ux5b7U;License: Standard Youtube License