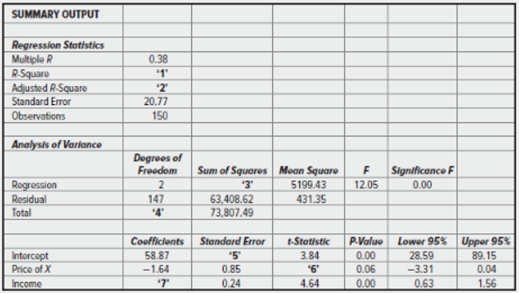
A Quant jock from your firm used a linear

- Based on these estimates, write an equation that summarizes the demand for the firm’s product.
- Which regression coefficients are statistically significant at the 5 percent level?
- Comment on how well the regression line fits the data.
(a)
In the given table, the missing values that need to be found are:
- R-square
- Adjusted R-square
- Sum of Squares of regression
- Degree of freedom
- Standard error of Intercept
- t-statistic for price of X
- coefficient estimate of income.
To find the values of these missing terms, we need to go through the following steps:
1) R-square is computed as the ratio of the explained sum of squares of the regression to the total sum of squared errors. That is,
From the given information Sum of Squares of regression can be calculated,
The value of Sum of Squares is 10,398.87
By putting this value in formula of R-square, we get
The value of R-square is 0.141
2) The formula of adjusted R-square is:
Where r-square = 0.141
K= 3 and
n= 150
by putting these values in the formula, we get
Therefore, the value of the adjusted r-square is 0.129.
3) the value of Sum of Squares of regression is equal to 10,398.87.
4)the total degree of freedom is the sum of degree of freedom for regression and degree of freedom for residual.
Total degree of freedom = 147+2
= 149
Therefore, the value of the total degree of freedom is 149.
5) The standard error of intercept
In the table value of t-statistic and parameter, a is given. By putting these values in t-statistic formula we get,
Therefore, the value of the standard error of the intercept is equal to 15.33.
6) By using the value of coefficient and standard error we get t-statistic.
Therefore, the value of t-statistic for the price of X is equal to -1.93.
7)by using the same formula of t-statistic, the coefficient estimates of income can be found.
When we put the given information in the formula, we get
Therefore, the value of the coefficient estimate of income is equal to 1.1136.
Based on these estimates, the linear demand function of regression model.
Explanation of Solution
The demand function of is:
Here, Px is the price of good X and M is the income.
(b)
The estimates that are statistically different from zero.
Explanation of Solution
If the absolute value of the t-statistics is greater than or equal to 2, then the corresponding parameter estimate is statistically different from zero.
From the computed values and table, we have these details:
| t-statistic | |
| Intercept | 3.84 |
| Price of X | -1.93 |
| Income | 4.64 |
Since the absolute value of t-statistic for intercept and income is greater than 2, the estimated coefficient of the intercept and income at 5% significant level are statistically different from zero.
(c)
The question requires to find how well this model fit for the data.
Explanation of Solution
he values of R-square and adjusted r-square is the measurement of goodness of fit to a model. Here the value of adjusted r-square is not very different from the value of r-square. They are:
R-square = 0.141
Adjusted R-square = 0.129
The values of both the estimates are very small that means the regression equation is not able to explain the dependent variable values. Therefore, the regression line is not a good fit for the data.
Want to see more full solutions like this?
Chapter 3 Solutions
EBK MANAGERIAL ECONOMICS & BUSINESS STR
- not use ai pleasearrow_forwardnot use ai pleasearrow_forward• Prismatic Cards: A prismatic card will be a card that counts as having every suit. We will denote, e.g., a prismatic Queen card by Q*. With this notation, 2.3045 Q would be a double flush since every card is a diamond and a heart. • Wild Cards: A wild card counts as having every suit and every denomination. Denote wild cards with a W; if there are multiple, we will denote them W₁, W2, etc. With this notation, W2 20.30054 would be both a three-of-a-kind (three 2's) and a flush (5 diamonds). If we add multiple wild cards to the deck, they count as distinct cards, so that (e.g.) the following two hands count as "different hands" when counting: W15 5Q and W255◊♡♡♣♣ In addition, 1. Let's start with the unmodified double-suited deck. (a) Call a hand a flush house if it is a flush and a full house, i.e. if all cards share a suit and there are 3 cards of one denomination and two of another. For example, 550. house. How many different flush house hands are there? 2. Suppose we add one wild…arrow_forward
- not use ai pleasearrow_forwardIn a classic oil-drilling example, you are trying to decide whether to drill for oil on a field that might or might not contain any oil. Before making this decision, you have the option of hiring a geologist to perform some seismic tests and then predict whether there is any oil or not. You assess that if there is actually oil, the geologist will predict there is oil with probability 0.85 . You also assess that if there is no oil, the geologist will predict there is no oil with probability 0.90. Please answer the two questions below, as I am trying to ensure that I am correct. 1. Why will these two probabilities not appear on the decision tree? 2. Which probabilities will be on the decision tree?arrow_forwardAsap pleasearrow_forward
- not use ai pleasearrow_forwardnot use ai pleasearrow_forwardIn this question, you will test relative purchasing parity (PPP) using the data. Use yearly data from FRED website from 1971 to 2020: (i) The Canadian Dollars to U.S. Dollar Spot Exchange Rate (ER) (ii) Consumer price index for Canada (CAN_CPI), and (iii) Consumer price index for the US (US_CPI). Inflation is measured by the consumer price index (CPI). The relative PPP equation is: AE CAN$/US$ ECAN$/US$ = π CAN - πUS Submit the Excel sheet that you worked on. 1. First, compute the percentage change in the exchange rate (left-hand side of the equation). Caculate the variable for each year from 1972 to 2020 in Column E (named Change_ER) of the Excel sheet. For example, for 1972, compute E3: (B3-B2)/B2). ER1972 ER1971 ER 1971 (in Excel, the formula in cellarrow_forward
- not use ai pleasearrow_forward8. The current price of 3M stock is $87 per share. The previous dividend paid was $5.96, and the next dividend is $6.25, assuming a growth rate of 4.86% per year. What is the forward (next 12 months) dividend yield? Show at least two decimal places, as in x.xx% %arrow_forwardJoy's Frozen Yogurt shops have enjoyed rapid growth in northeastern states in recent years. From the analysis of Joy's various outlets, it was found that the demand curve follows this pattern: Q=200-300P+1201 +657-250A +400A; where Q = number of cups served per week P = average price paid for each cup I = per capita income in the given market (thousands) Taverage outdoor temperature A competition's monthly advertising expenditures (thousands) = A; = Joy's own monthly advertising expenditures (thousands) One of the outlets has the following conditions: P = 1.50, I = 10, T = 60, A₁ = 15, A; = 10 1. Estimate the number of cups served per week by this outlet. Also determine the outlet's demand curve. 2. What would be the effect of a $5,000 increase in the competitor's advertising expenditure? Illustrate the effect on the outlet's demand curve. 3. What would Joy's advertising expenditure have to be to counteract this effect?arrow_forward


 Managerial Economics: Applications, Strategies an...EconomicsISBN:9781305506381Author:James R. McGuigan, R. Charles Moyer, Frederick H.deB. HarrisPublisher:Cengage Learning
 Economics Today and Tomorrow, Student EditionEconomicsISBN:9780078747663Author:McGraw-HillPublisher:Glencoe/McGraw-Hill School Pub Co


