
Essentials Of Statistics For Business & Economics
9th Edition
ISBN: 9780357045435
Author: David R. Anderson, Dennis J. Sweeney, Thomas A. Williams, Jeffrey D. Camm, James J. Cochran
Publisher: South-Western College Pub
expand_more
expand_more
format_list_bulleted
Concept explainers
Videos
Textbook Question
Chapter 3, Problem 71SE
NFL Teams Worth. In 2014, the 32 teams in the National Football League (NFL) were worth, on average, $1.17 billion, 5% more than in 2013. The following data show the annual revenue ($ millions) and the estimated team value ($ millions) for the 32 NFL teams in 2014 (Forbes website).
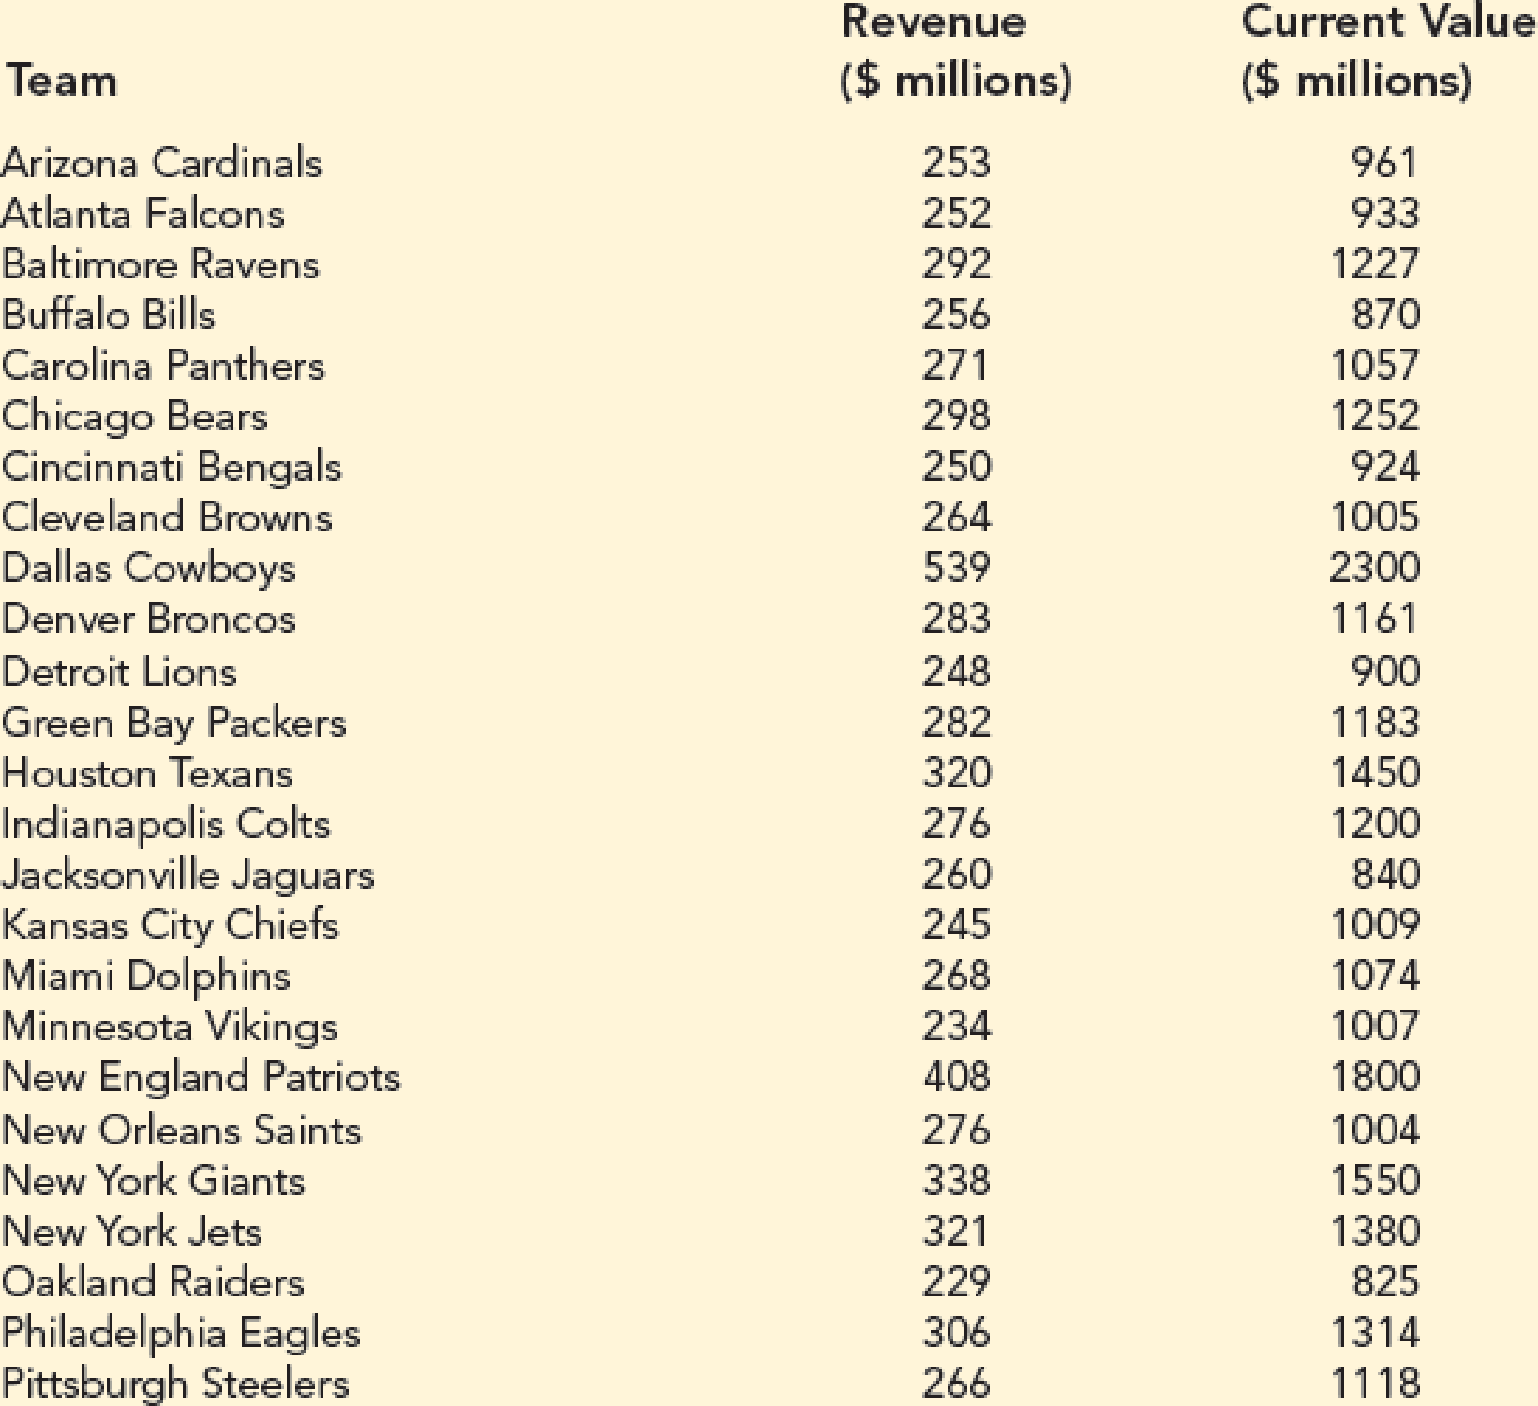
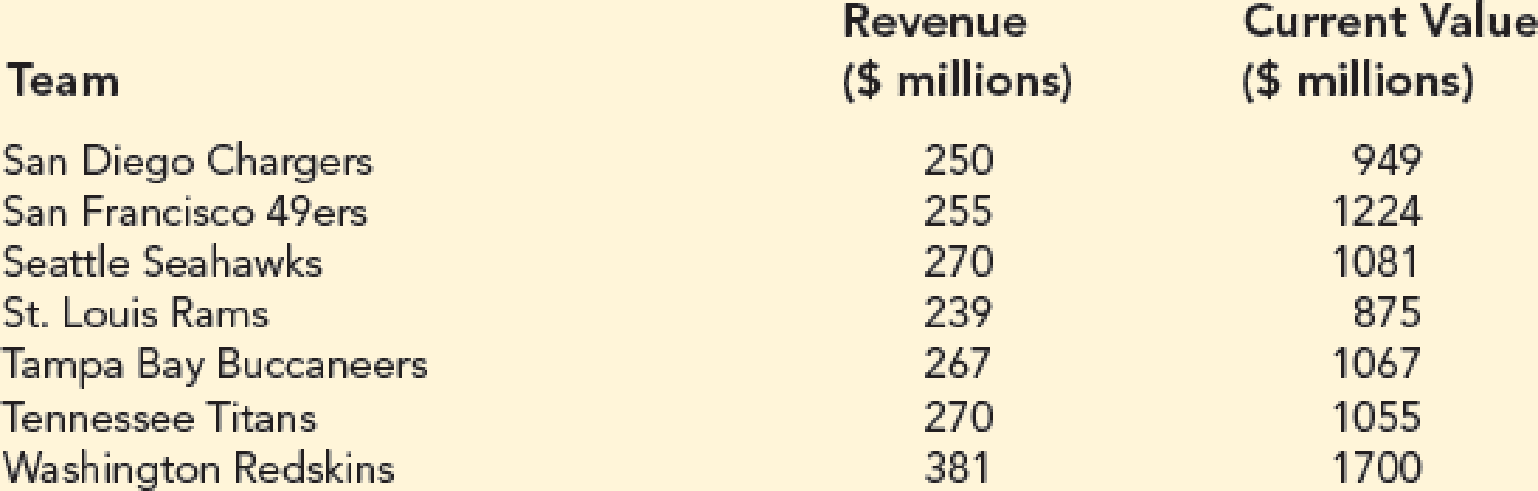
- a. Develop a
scatter diagram with Revenue on the horizontal axis and Value on the vertical axis. Does there appear that there is any relationship between the two variables? - b. What is the sample
correlation coefficient ? What can you say about the strength of the relationship between Revenue and Value?
Expert Solution & Answer

Trending nowThis is a popular solution!

Students have asked these similar questions
mean trough level of the population to be 3.7 micrograms/mL. The researcher conducts a study among 93 newly diagnosed arthritis patients and finds the mean trough to be 4.1 micrograms/mL with a standard deviation of 2.4 micrograms/mL. The researcher wants to test at the 5% level of significance if the trough is different than previously reported or not. Z statistics will be used.
Complete Step 5 of hypothesis testing: Conclusion. State whether or not you would reject the null hypothesis and why. Also interpret what this means (i.e. is the mean trough different from 3.7 or no
30% of all college students major in STEM (Science, Technology, Engineering, and Math). If 48 college students are randomly selected, find the probability thata. Exactly 12 of them major in STEM. b. At most 17 of them major in STEM. c. At least 12 of them major in STEM. d. Between 9 and 13 (including 9 and 13) of them major in STEM.
7% of all Americans live in poverty. If 40 Americans are randomly selected, find the probability thata. Exactly 4 of them live in poverty. b. At most 1 of them live in poverty. c. At least 1 of them live in poverty. d. Between 2 and 9 (including 2 and 9) of them live in poverty.
Chapter 3 Solutions
Essentials Of Statistics For Business & Economics
Ch. 3.1 - Consider a sample with data values of 10, 20, 12,...Ch. 3.1 - Consider a sample with data values of 10, 20, 21,...Ch. 3.1 - Consider the following data and corresponding...Ch. 3.1 - Consider the following data.
What is the mean...Ch. 3.1 - Consider a sample with data values of 27, 25, 20,...Ch. 3.1 - Consider a sample with data values of 53, 55, 70,...Ch. 3.1 - eICU Waiting Times. There is a severe shortage of...Ch. 3.1 - Middle-Level Manager Salaries. Suppose that an...Ch. 3.1 - Advertising Spending. Which companies spend the...Ch. 3.1 - Advertising Spending. Which companies spend the...
Ch. 3.1 - Time Spent Watching Traditional TV. Nielsen tracks...Ch. 3.1 - Online Multiplayer Game Downloads. The creator of...Ch. 3.1 - Automobile Fuel Efficiencies. In automobile...Ch. 3.1 - Unemployment Rates by State. The U.S. Bureau of...Ch. 3.1 - Motor Oil Prices. Martinez Auto Supplies has...Ch. 3.1 - Calculating Grade Point Averages. The grade point...Ch. 3.1 - The following table shows the total return and the...Ch. 3.1 - Business School Ranking. Based on a survey of...Ch. 3.1 - Revenue Growth Rate. Annual revenue for Corning...Ch. 3.1 - Mutual Fund Comparison. Suppose that at the...Ch. 3.1 - If an asset declines in value from $5000 to $3500...Ch. 3.1 - The current value of a company is 25 million. If...Ch. 3.2 - Consider a sample with data values of 10, 20, 12,...Ch. 3.2 - Consider a sample with data values of 10, 20, 12,...Ch. 3.2 - Consider a sample with data values of 27, 25, 20,...Ch. 3.2 - Price of Unleaded Gasoline. Data collected by the...Ch. 3.2 - Round-Trip Flight Prices. The following table...Ch. 3.2 - Annual Sales Amounts. Varatta Enterprises sells...Ch. 3.2 - Air Quality Index. The Los Angeles Times regularly...Ch. 3.2 - Prob. 30ECh. 3.2 - Cellular Phone Spending. According to the 2016...Ch. 3.2 - Advertising Spend by Companies. Advertising Age...Ch. 3.2 - Amateur Golfer Scores. Scores turned in by an...Ch. 3.2 - Consistency of Running Times. The following times...Ch. 3.3 - Consider a sample with data values of 10, 20, 12,...Ch. 3.3 - Prob. 36ECh. 3.3 - Consider a sample with a mean of 30 and a standard...Ch. 3.3 - Suppose the data have a bell-shaped distribution...Ch. 3.3 - The results of a national survey showed that on...Ch. 3.3 - Price per Gallon of Gasoline. Suppose that the...Ch. 3.3 - GMAT Exam Scores. The Graduate Management...Ch. 3.3 - Many families in California are using backyard...Ch. 3.3 - Best Places to Live. Each year Money magazine...Ch. 3.3 - NCAA Basketball Game Scores. A sample of 10 NCAA...Ch. 3.3 - Prob. 45ECh. 3.4 - Consider a sample with data values of 27, 25, 20,...Ch. 3.4 - Show the boxplot for the data in exercise 46. 46....Ch. 3.4 - Prob. 48ECh. 3.4 - Prob. 49ECh. 3.4 - Naples Half-Marathon Times. Naples, Florida, hosts...Ch. 3.4 - Pharmaceutical Company Sales. Annual sales, in...Ch. 3.4 - Cell Phone Companies Customer Satisfaction....Ch. 3.4 - Most Admired Companies. Fortune magazines list of...Ch. 3.4 - U.S. Border Crossings. The Bureau of...Ch. 3.5 - Five observations taken for two variables follow....Ch. 3.5 - Five observations taken for two variables follow....Ch. 3.5 - Stock Price Comparison. The file StockComparison...Ch. 3.5 - Driving Speed and Fuel Efficiency. A department of...Ch. 3.5 - Smoke Detector Use and Death Rates. Over the past...Ch. 3.5 - Stock Market Indexes Comparison. The Russell 1000...Ch. 3.5 - Best Private Colleges. A random sample of 30...Ch. 3 - Americans Dining Out. Americans tend to dine out...Ch. 3 - NCAA Football Coaches Salaries. A 2017 USA Today...Ch. 3 - Physician Office Waiting Times. The average...Ch. 3 - Worker Productivity and Insomnia. U.S. companies...Ch. 3 - Work Commuting Methods. Public transportation and...Ch. 3 - Household Incomes. The following data represent a...Ch. 3 - Prob. 69SECh. 3 - Best Hotels. Travel + Leisure magazine provides an...Ch. 3 - NFL Teams Worth. In 2014, the 32 teams in the...Ch. 3 - MLB Team Winning Percentages. Does a major league...Ch. 3 - Money Market Funds Days to Maturity. The days to...Ch. 3 - Automobile Speeds. Automobiles traveling on a road...Ch. 3 - Annual Returns for Panama Railroad Company Stock....Ch. 3 - Pelican Stores, a division of National Clothing,...Ch. 3 - Prob. 2CPCh. 3 - The pursuit of a higher education degree in...Ch. 3 - Although millions of elephants once roamed across...
Knowledge Booster


Learn more about
Need a deep-dive on the concept behind this application? Look no further. Learn more about this topic, statistics and related others by exploring similar questions and additional content below.Similar questions
- 48% of all violent felons in the prison system are repeat offenders. If 40 violent felons are randomly selected, find the probability that a. Exactly 18 of them are repeat offenders. b. At most 18 of them are repeat offenders. c. At least 18 of them are repeat offenders. d. Between 17 and 21 (including 17 and 21) of them are repeat offenders.arrow_forwardConsider an MA(6) model with θ1 = 0.5, θ2 = −25, θ3 = 0.125, θ4 = −0.0625, θ5 = 0.03125, and θ6 = −0.015625. Find a much simpler model that has nearly the same ψ-weights.arrow_forwardLet {Yt} be an AR(2) process of the special form Yt = φ2Yt − 2 + et. Use first principles to find the range of values of φ2 for which the process is stationary.arrow_forward
- Describe the important characteristics of the autocorrelation function for the following models: (a) MA(1), (b) MA(2), (c) AR(1), (d) AR(2), and (e) ARMA(1,1).arrow_forward« CENGAGE MINDTAP Quiz: Chapter 38 Assignment: Quiz: Chapter 38 ips Questions ra1kw08h_ch38.15m 13. 14. 15. O Which sentence has modifiers in the correct place? O a. When called, she for a medical emergency responds quickly. b. Without giving away too much of the plot, Helena described the heroine's actions in the film. O c. Nearly the snakebite victim died before the proper antitoxin was injected. . O O 16 16. O 17. 18. O 19. O 20 20. 21 21. 22. 22 DS 23. 23 24. 25. O O Oarrow_forwardQuestions ra1kw08h_ch36.14m 12. 13. 14. 15. 16. Ӧ 17. 18. 19. OS 20. Two separate sentences need Oa. two separate subjects. Ob. two dependent clauses. c. one shared subject.arrow_forward
- Customers experiencing technical difficulty with their Internet cable service may call an 800 number for technical support. It takes the technician between 30 seconds and 11 minutes to resolve the problem. The distribution of this support time follows the uniform distribution. Required: a. What are the values for a and b in minutes? Note: Do not round your intermediate calculations. Round your answers to 1 decimal place. b-1. What is the mean time to resolve the problem? b-2. What is the standard deviation of the time? c. What percent of the problems take more than 5 minutes to resolve? d. Suppose we wish to find the middle 50% of the problem-solving times. What are the end points of these two times?arrow_forwardExercise 6-6 (Algo) (LO6-3) The director of admissions at Kinzua University in Nova Scotia estimated the distribution of student admissions for the fall semester on the basis of past experience. Admissions Probability 1,100 0.5 1,400 0.4 1,300 0.1 Click here for the Excel Data File Required: What is the expected number of admissions for the fall semester? Compute the variance and the standard deviation of the number of admissions. Note: Round your standard deviation to 2 decimal places.arrow_forward1. Find the mean of the x-values (x-bar) and the mean of the y-values (y-bar) and write/label each here: 2. Label the second row in the table using proper notation; then, complete the table. In the fifth and sixth columns, show the 'products' of what you're multiplying, as well as the answers. X y x minus x-bar y minus y-bar (x minus x-bar)(y minus y-bar) (x minus x-bar)^2 xy 16 20 34 4-2 5 2 3. Write the sums that represents Sxx and Sxy in the table, at the bottom of their respective columns. 4. Find the slope of the Regression line: bi = (simplify your answer) 5. Find the y-intercept of the Regression line, and then write the equation of the Regression line. Show your work. Then, BOX your final answer. Express your line as "y-hat equals...arrow_forward
- Apply STATA commands & submit the output for each question only when indicated below i. Generate the log of birthweight and family income of children. Name these new variables Ibwght & Ifaminc. Include the output of this code. ii. Apply the command sum with the detail option to the variable faminc. Note: you should find the 25th percentile value, the 50th percentile and the 75th percentile value of faminc from the output - you will need it to answer the next question Include the output of this code. iii. iv. Use the output from part ii of this question to Generate a variable called "high_faminc" that takes a value 1 if faminc is less than or equal to the 25th percentile, it takes the value 2 if faminc is greater than 25th percentile but less than or equal to the 50th percentile, it takes the value 3 if faminc is greater than 50th percentile but less than or equal to the 75th percentile, it takes the value 4 if faminc is greater than the 75th percentile. Include the outcome of this code…arrow_forwardsolve this on paperarrow_forwardApply STATA commands & submit the output for each question only when indicated below i. Apply the command egen to create a variable called "wyd" which is the rowtotal function on variables bwght & faminc. ii. Apply the list command for the first 10 observations to show that the code in part i worked. Include the outcome of this code iii. Apply the egen command to create a new variable called "bwghtsum" using the sum function on variable bwght by the variable high_faminc (Note: need to apply the bysort' statement) iv. Apply the "by high_faminc" statement to find the V. descriptive statistics of bwght and bwghtsum Include the output of this code. Why is there a difference between the standard deviations of bwght and bwghtsum from part iv of this question?arrow_forward
arrow_back_ios
SEE MORE QUESTIONS
arrow_forward_ios
Recommended textbooks for you
 Holt Mcdougal Larson Pre-algebra: Student Edition...AlgebraISBN:9780547587776Author:HOLT MCDOUGALPublisher:HOLT MCDOUGAL
 Glencoe Algebra 1, Student Edition, 9780079039897...AlgebraISBN:9780079039897Author:CarterPublisher:McGraw Hill
 Algebra: Structure And Method, Book 1AlgebraISBN:9780395977224Author:Richard G. Brown, Mary P. Dolciani, Robert H. Sorgenfrey, William L. ColePublisher:McDougal Littell
 Functions and Change: A Modeling Approach to Coll...AlgebraISBN:9781337111348Author:Bruce Crauder, Benny Evans, Alan NoellPublisher:Cengage Learning
Holt Mcdougal Larson Pre-algebra: Student Edition...
Algebra
ISBN:9780547587776
Author:HOLT MCDOUGAL
Publisher:HOLT MCDOUGAL
Glencoe Algebra 1, Student Edition, 9780079039897...
Algebra
ISBN:9780079039897
Author:Carter
Publisher:McGraw Hill
Algebra: Structure And Method, Book 1
Algebra
ISBN:9780395977224
Author:Richard G. Brown, Mary P. Dolciani, Robert H. Sorgenfrey, William L. Cole
Publisher:McDougal Littell
Functions and Change: A Modeling Approach to Coll...
Algebra
ISBN:9781337111348
Author:Bruce Crauder, Benny Evans, Alan Noell
Publisher:Cengage Learning
The Shape of Data: Distributions: Crash Course Statistics #7; Author: CrashCourse;https://www.youtube.com/watch?v=bPFNxD3Yg6U;License: Standard YouTube License, CC-BY
Shape, Center, and Spread - Module 20.2 (Part 1); Author: Mrmathblog;https://www.youtube.com/watch?v=COaid7O_Gag;License: Standard YouTube License, CC-BY
Shape, Center and Spread; Author: Emily Murdock;https://www.youtube.com/watch?v=_YyW0DSCzpM;License: Standard Youtube License