Essentials Of Modern Business Statistics With Microsoft Excel, Loose-leaf Version
7th Edition
ISBN: 9781337298308
Author: David R. Anderson, Dennis J. Sweeney, Thomas A. Williams, Jeffrey D. Camm, James J. Cochran
Publisher: Cengage Learning
expand_more
expand_more
format_list_bulleted
Concept explainers
Videos
Textbook Question
Chapter 3, Problem 71SE
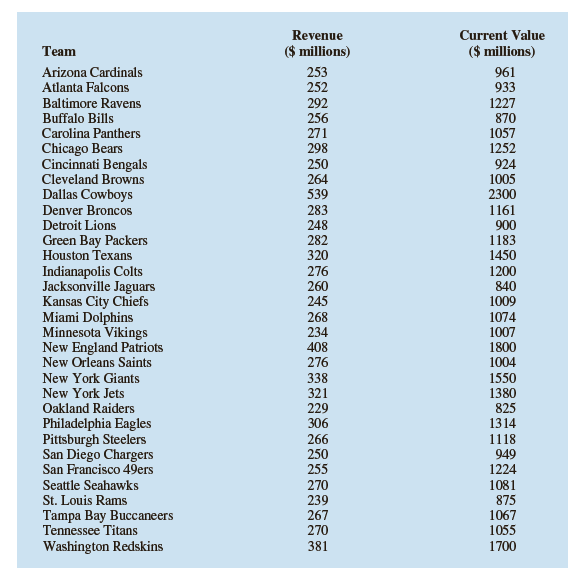
The 32 teams in the National Football League (NFL) are worth, on average, $1.17 billion, 5% more than last year. The following data show the annual revenue ($ millions) and the estimated team value ($ millions) for the 32 NFL teams (Forbes website, February 28, 2014).
a.Develop a
b.What is the sample
Expert Solution & Answer
Want to see the full answer?
Check out a sample textbook solution
Students have asked these similar questions
Example 4 (Part 2) We can use Statkey to take 50 different random samples of size 20 each, find the mean of
each sample, and compute a confidence interval for each one. The graph of the sampling distribution of the means
is on the left below, and that of the 50 confidence intervals is on the right.
1. What does each dot on the left hand dotplot represent?
StatKey Sampling Distribution for a Mean
Percent with Internet Access (Countries) ▾
Show Data Table Edit Data
Choose samples of size n =
20
Upload File
Change Column(s)
Generate 1 Sample
Generate 10 Samples
Generate 100 Samples
Generate 1000 Samples
Reset Plot
Sampling Dotplot of Mean
Left Tail Two-Tail Right Tail
60
50
40
40
30
20
20
10
samples = 50
mean = 41.626
std. error = 5.089
:
.:
:
::
0
25
30
35
40
45
50
55
60
41.626
Data Plots
Confidence Intervals
95%->
Confidence Intervals
Coverage
48/50 = 96%
20
40
60
80
2. Circle the confidence intervals that failed to capture the true mean.
3. Circle the sample means that produced those…
Example 4 (Part 1) One of the datasets in the Lock book
contains information about 215 countries of the world. One
of the variables is the percentage of people in the country
who have access to the internet. We have data for 203 of
those countries. The plot on the right shows a dotplot of
the data.
1. What are the cases?
Population
n = 203, mean = 43.024
median = 43.5, stdev = 29.259
20
2. What does each dot on the dotplot represent?
15
10
5
20
40
43.024
60
80
3. What type of data is do we collect from the cases, quantitative or categorical?
Let x be a random variable that represents the percentage of successful free throws a professional basketball player makes in a season. Let y be a random variable that represents the percentage of successful field goals a professional basketball player makes in a season. A random sample of n =6 professional basketball players gave the following information.
x
63
79
70
80
84
87
y
46
49
45
55
57
58
Find Se. Round your answer to three decimal places.
Chapter 3 Solutions
Essentials Of Modern Business Statistics With Microsoft Excel, Loose-leaf Version
Ch. 3.1 - Consider a sample with data values of 10, 20, 12,...Ch. 3.1 - Consider a sample with data values of 10, 20, 21,...Ch. 3.1 - Consider the following data and corresponding...Ch. 3.1 - Consider the following data. What is the mean...Ch. 3.1 - Prob. 5ECh. 3.1 - Prob. 6ECh. 3.1 - The average number of minutes Americans commute to...Ch. 3.1 - The WWI Street Journal reported that the median...Ch. 3.1 - Which companies spend the most money on...Ch. 3.1 - Prob. 10E
Ch. 3.1 - According to the National Education Association...Ch. 3.1 - The Big Bang Theory, a situation comedy featuring...Ch. 3.1 - In automobile mileage and gasoline-consumption...Ch. 3.1 - Prob. 14ECh. 3.1 - Martinez Auto Supplies has retail stores located...Ch. 3.1 - The grade point average for college students is...Ch. 3.1 - The following table shows the total return and the...Ch. 3.1 - Prob. 18ECh. 3.1 - Prob. 19ECh. 3.1 - Prob. 20ECh. 3.1 - If an asset declines in value from $5000 to $3500...Ch. 3.1 - The current value of a company is $25 million. If...Ch. 3.2 - Consider a sample with data values of 10, 20, 12,...Ch. 3.2 - Prob. 24ECh. 3.2 - Prob. 25ECh. 3.2 - Data collected by the Oil Price Information...Ch. 3.2 - The results of a search to find the least...Ch. 3.2 - The Australian Open is the first of the four Grand...Ch. 3.2 - Prob. 29ECh. 3.2 - The following data were used to construct the...Ch. 3.2 - Prob. 31ECh. 3.2 - Prob. 32ECh. 3.2 - Scores turned in by an amateur golfer at the...Ch. 3.2 - The following times were recorded by the...Ch. 3.3 - Consider a sample with data values of 10, 20, 12,...Ch. 3.3 - Prob. 36ECh. 3.3 - Prob. 37ECh. 3.3 - Prob. 38ECh. 3.3 - The results of a national survey showed that on...Ch. 3.3 - Prob. 40ECh. 3.3 - Prob. 41ECh. 3.3 - Many families in California are using backyard...Ch. 3.3 - Prob. 43ECh. 3.3 - Prob. 44ECh. 3.3 - The Wall Street Journal reported that Walmart...Ch. 3.4 - Prob. 46ECh. 3.4 - Prob. 47ECh. 3.4 - Prob. 48ECh. 3.4 - Prob. 49ECh. 3.4 - Naples, Florida hosts a half-marathon (13.1 -mile...Ch. 3.4 - Annual sales, in millions of dollars, for 21...Ch. 3.4 - Consumer Reports provided overall customer...Ch. 3.4 - Fortune magazine's list of the world's most...Ch. 3.4 - Prob. 54ECh. 3.5 - Five observations taken for two variables follow...Ch. 3.5 - Five observations taken for two variables follow...Ch. 3.5 - Prob. 57ECh. 3.5 - A department of transportation's study on driving...Ch. 3.5 - Over the past 40 years, the percentage of homes in...Ch. 3.5 - Prob. 60ECh. 3.5 - A random sample of 30 colleges from Kiplinger's...Ch. 3 - The average number of times Americans dine out in...Ch. 3 - Prob. 63SECh. 3 - The average waiting time for a patient at an El...Ch. 3 - U.S. companies lose $63.2 billion per year from...Ch. 3 - Prob. 66SECh. 3 - Public transportation and the automobile are two...Ch. 3 - In 2007 the New York Times reported that the...Ch. 3 - Prob. 69SECh. 3 - Travel + Leisure magazine presented its annual...Ch. 3 - The 32 teams in the National Football League (NFL)...Ch. 3 - Does a major league baseball team's record during...Ch. 3 - The days to maturity for a sample of five money...Ch. 3 - Automobiles traveling on a road with a posted...Ch. 3 - The Panama Railroad Company was established in...Ch. 3 - Case Problem 1 Pelican Stores Pelican S to res, a...Ch. 3 - Case Problem 1 Pelican Stores Pelican S to res, a...Ch. 3 - Problem 2Motion Picture Industry The motion...Ch. 3 - Case Problem 2 Motion Picture Industry The motion...Ch. 3 - Case Problem 2 Motion Picture Industry The motion...Ch. 3 - Case Problem 3 Business Schools of Asia-Pacific...Ch. 3 - Case Problem 3 Business Schools of Asia-Pacific...Ch. 3 - Case Problem 3 Business Schools of Asia-Pacific...Ch. 3 - Case Problem 3 Business Schools of Asia-Pacific...Ch. 3 - Case Problem 5 African Elephant Populations...Ch. 3 - Case Problem 5 African Elephant Populations...Ch. 3 - Case Problem 5 African Elephant Populations...
Knowledge Booster


Learn more about
Need a deep-dive on the concept behind this application? Look no further. Learn more about this topic, statistics and related others by exploring similar questions and additional content below.Similar questions
- 1. Define probability: 2. Define statistics:arrow_forwardResults of tossing a coin four times: H, H, H, H How many times is the Coin expected to come up heads? How did you determine this number? Calculate the % deviation. Can these results be used to conclude that a coin is not fair? Why or why not?arrow_forwardCycles to failure Position in ascending order 0.5 f(x)) (x;) Problem 44 Marsha, a renowned cake scientist, is trying to determine how long different cakes can survive intense fork attacks before collapsing into crumbs. To simulate real-world cake consumption, she designs a test where cakes are subjected to repeated fork stabs and bites, mimicking the brutal reality of birthday parties. After rigorous testing, Marsha records 10 observations of how many stabs each cake endured before structural failure. Construct P-P plots for (a.) a normal distribution, (b.) a lognormal distribution, and (c.) a Weibull distribution (using the information included in the table below). Which distribution seems to be the best model for the cycles to failure for this material? Explain your answer in detail. Observation Empirical cumulative Probability distribution Cumulative distribution Inverse of cumulative distribution F-1 (-0.5) F(x)) (S) n 4 3 1 0.05 9 5 2 0.15 7 7 3 0.25 1 10 4 0.35 3 12 5 0.45 Normal…arrow_forward
- Problem 3 In their lab, engineer Daniel and Paulina are desperately trying to perfect time travel. But the problem is that their machine still struggles with power inconsistencies-sometimes generating too little energy, other times too much, causing unstable time jumps. To prevent catastrophic misjumps into the Jurassic era or the far future, they must calibrate the machine's power output. After extensive testing, they found that the time machine's power output follows a normal distribution, with an average energy level of 8.7 gigawatts and a standard deviation of 1.2 gigawatts. The Time Travel Safety Board has set strict guidelines: For a successful time jump, the machine's power must be between 8.5 and 9.5 gigawatts. What is the probability that a randomly selected time jump meets this precision requirement? Daniel suggests that adjusting the mean power output could improve time-travel accuracy. Can adjusting the mean reduce the number of dangerous misjumps? If yes, what should the…arrow_forwardProblem 5 ( Marybeth is also interested in the experiment from Problem 2 (associated with the enhancements for Captain America's shield), so she decides to start a detailed literature review on the subject. Among others, she found a paper where they used a 2"(4-1) fractional factorial design in the factors: (A) shield material, (B) throwing mechanism, (C) edge modification, and (D) handle adjustment. The experimental design used in the paper is shown in the table below. a. Run A B с D 1 (1) -1 -1 -1 1 2 a 1 -1 -1 1 3 bd -1 1 -1 1 4 abd 1 1 -1 1 5 cd -1 -1 1 -1 6 acd 1 -1 1 -1 7 bc -1 1 1 -1 abc 1 1 1 -1 paper? s) What was the generator used in the 2"(4-1) fractional factorial design described in the b. Based on the resolution of this design, what do you think about the generator used in the paper? Do you think it was a good choice, or would you have selected a different one? Explain your answer in detail.arrow_forwardSuppose we wish to test the hypothesis that women with a sister’s history of breast cancer are at higher risk of developing breast cancer themselves. Suppose we assume that the prevalence rate of breast cancer is 3% among 60- to 64-year-old U.S. women, whereas it is 5% among women with a sister history. We propose to interview 400 women 40 to 64 years of age with a sister history of the disease. What is the power of such a study assuming that the level of significance is 10%? I only need help writing the null and alternative hypotheses.arrow_forward
- 4.96 The breaking strengths for 1-foot-square samples of a particular synthetic fabric are approximately normally distributed with a mean of 2,250 pounds per square inch (psi) and a standard deviation of 10.2 psi. Find the probability of selecting a 1-foot-square sample of material at random that on testing would have a breaking strength in excess of 2,265 psi.4.97 Refer to Exercise 4.96. Suppose that a new synthetic fabric has been developed that may have a different mean breaking strength. A random sample of 15 1-foot sections is obtained, and each section is tested for breaking strength. If we assume that the population standard deviation for the new fabric is identical to that for the old fabric, describe the sampling distribution forybased on random samples of 15 1-foot sections of new fabricarrow_forwardUne Entreprise œuvrant dans le domaine du multividéo donne l'opportunité à ses programmeurs-analystes d'évaluer la performance des cadres supérieurs. Voici les résultats obtenues (sur une échelle de 10 à 50) où 50 représentent une excellente performance. 10 programmeurs furent sélectionnés au hazard pour évaluer deux cadres. Un rapport Excel est également fourni. Programmeurs Cadre A Cadre B 1 34 36 2 32 34 3 18 19 33 38 19 21 21 23 7 35 34 8 20 20 9 34 34 10 36 34 Test d'égalité des espérances: observations pairéesarrow_forwardA television news channel samples 25 gas stations from its local area and uses the results to estimate the average gas price for the state. What’s wrong with its margin of error?arrow_forward
- You’re fed up with keeping Fido locked inside, so you conduct a mail survey to find out people’s opinions on the new dog barking ordinance in a certain city. Of the 10,000 people who receive surveys, 1,000 respond, and only 80 are in favor of it. You calculate the margin of error to be 1.2 percent. Explain why this reported margin of error is misleading.arrow_forwardYou find out that the dietary scale you use each day is off by a factor of 2 ounces (over — at least that’s what you say!). The margin of error for your scale was plus or minus 0.5 ounces before you found this out. What’s the margin of error now?arrow_forwardSuppose that Sue and Bill each make a confidence interval out of the same data set, but Sue wants a confidence level of 80 percent compared to Bill’s 90 percent. How do their margins of error compare?arrow_forward
arrow_back_ios
SEE MORE QUESTIONS
arrow_forward_ios
Recommended textbooks for you
 Glencoe Algebra 1, Student Edition, 9780079039897...AlgebraISBN:9780079039897Author:CarterPublisher:McGraw Hill
 Big Ideas Math A Bridge To Success Algebra 1: Stu...AlgebraISBN:9781680331141Author:HOUGHTON MIFFLIN HARCOURTPublisher:Houghton Mifflin Harcourt
 Functions and Change: A Modeling Approach to Coll...AlgebraISBN:9781337111348Author:Bruce Crauder, Benny Evans, Alan NoellPublisher:Cengage Learning
 Holt Mcdougal Larson Pre-algebra: Student Edition...AlgebraISBN:9780547587776Author:HOLT MCDOUGALPublisher:HOLT MCDOUGAL
 College Algebra (MindTap Course List)AlgebraISBN:9781305652231Author:R. David Gustafson, Jeff HughesPublisher:Cengage Learning
Glencoe Algebra 1, Student Edition, 9780079039897...
Algebra
ISBN:9780079039897
Author:Carter
Publisher:McGraw Hill
Big Ideas Math A Bridge To Success Algebra 1: Stu...
Algebra
ISBN:9781680331141
Author:HOUGHTON MIFFLIN HARCOURT
Publisher:Houghton Mifflin Harcourt
Functions and Change: A Modeling Approach to Coll...
Algebra
ISBN:9781337111348
Author:Bruce Crauder, Benny Evans, Alan Noell
Publisher:Cengage Learning
Holt Mcdougal Larson Pre-algebra: Student Edition...
Algebra
ISBN:9780547587776
Author:HOLT MCDOUGAL
Publisher:HOLT MCDOUGAL
College Algebra (MindTap Course List)
Algebra
ISBN:9781305652231
Author:R. David Gustafson, Jeff Hughes
Publisher:Cengage Learning
Correlation Vs Regression: Difference Between them with definition & Comparison Chart; Author: Key Differences;https://www.youtube.com/watch?v=Ou2QGSJVd0U;License: Standard YouTube License, CC-BY
Correlation and Regression: Concepts with Illustrative examples; Author: LEARN & APPLY : Lean and Six Sigma;https://www.youtube.com/watch?v=xTpHD5WLuoA;License: Standard YouTube License, CC-BY