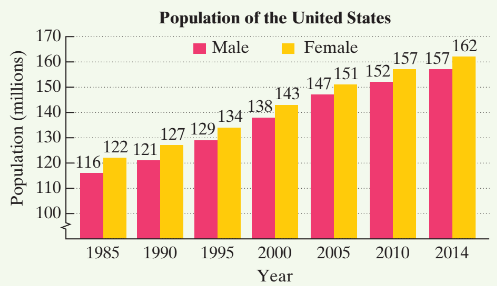
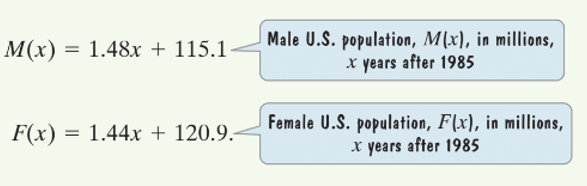
The bar graph shows the population of the United States, in millions, for six selected years. Source: U.S. Census Bureau Here are two functions that model the data: a. Write a function that models the total U.S. population, P ( x ) in millions, x years after 1985. b. Write a rational function that models the fraction of men in the U.S. population, R ( x ), x years after 1985. c. What is the equation of the horizontal asymptote associated with the function in part (b)? Round to two decimal places. What does this mean about the percentage of men in the U.S. population over time?
The bar graph shows the population of the United States, in millions, for six selected years. Source: U.S. Census Bureau Here are two functions that model the data: a. Write a function that models the total U.S. population, P ( x ) in millions, x years after 1985. b. Write a rational function that models the fraction of men in the U.S. population, R ( x ), x years after 1985. c. What is the equation of the horizontal asymptote associated with the function in part (b)? Round to two decimal places. What does this mean about the percentage of men in the U.S. population over time?
Solution Summary: The author calculates the function that models the U.S. Population from the graph. The function is underset_f(x)=2.92x+236.
The bar graph shows the population of the United States, in millions, for six selected years.
Source: U.S. Census Bureau
Here are two functions that model the data:
a. Write a function that models the total U.S. population, P(x) in millions, x years after 1985.
b. Write a rational function that models the fraction of men in the U.S. population, R(x), x years after 1985.
c. What is the equation of the horizontal asymptote associated with the function in part (b)? Round to two decimal places. What does this mean about the percentage of men in the U.S. population over time?
Consider the table of values below.
x
y
2
64
3
48
4
36
5
27
Fill in the right side of the equation y= with an expression that makes each ordered pari (x,y) in the table a solution to the equation.
solving for x
Consider the table of values below.
x
y
2
63
3
70
4
77
5
84
Fill in the right side of the equation y= with an expression that makes each ordered pari (x,y) in the table a solution to the equation.
Need a deep-dive on the concept behind this application? Look no further. Learn more about this topic, algebra and related others by exploring similar questions and additional content below.


 Glencoe Algebra 1, Student Edition, 9780079039897...AlgebraISBN:9780079039897Author:CarterPublisher:McGraw Hill
 Holt Mcdougal Larson Pre-algebra: Student Edition...AlgebraISBN:9780547587776Author:HOLT MCDOUGALPublisher:HOLT MCDOUGAL
 Algebra for College StudentsAlgebraISBN:9781285195780Author:Jerome E. Kaufmann, Karen L. SchwittersPublisher:Cengage Learning
 Algebra: Structure And Method, Book 1AlgebraISBN:9780395977224Author:Richard G. Brown, Mary P. Dolciani, Robert H. Sorgenfrey, William L. ColePublisher:McDougal Littell