
Concept explainers
Videos
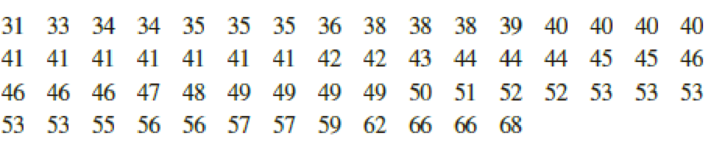
Political Science: Georgia Democrats How Democratic is Georgia? County-by-county results are shown for a recent election. For your convenience, the data have been sorted in increasing order (Source: County and City Data Book, 12th edition, U.S. Census Bureau).
Percentage of Democratic vote by counties in Georgia
- (a) Make a box-and-whisker plot of the data. Find the
interquartile range . - (b) Grouped Data Make a frequency table using five classes. Then estimate the
mean and sample standard deviation using the frequency table. Compute a 75% Chebyshev interval centered about the mean. - (c) If you have a statistical calculator or computer, use it to find the actual sample mean and sample standard deviation. Otherwise, use the values Σx – 2769 and Σx2 – 132,179 to compute the sample mean and sample standard deviation.
a.
Draw the box-and-whisker plot.
Find the interquartile range.
Answer to Problem 5CRP
The box-and-whisker plot is shown below:
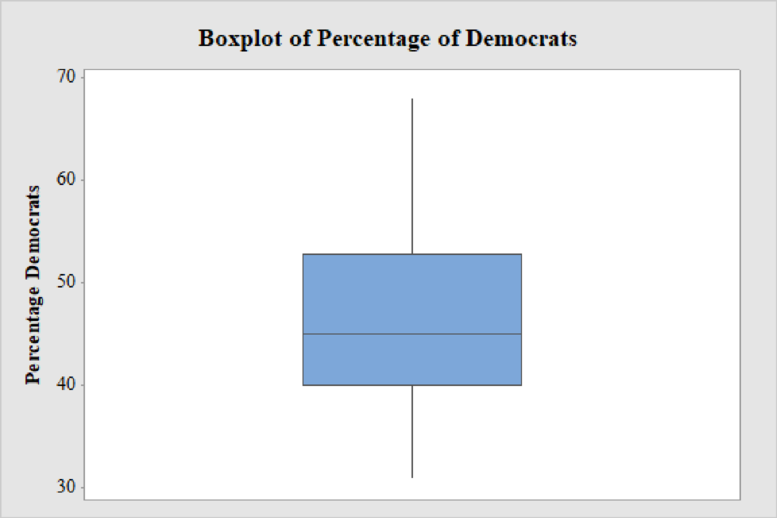
The interquartile range is 12.75.
Explanation of Solution
Step-by-step procedure to draw the box-and-whisker plot using MINITAB software:
- Choose Graph > Boxplot or Stat > EDA > Boxplot.
- Under One Y, choose Simple. Click OK.
- In Graph variables, enter the data of Democrats.
- Click OK in all dialogue boxes.
Step-by-step procedure to obtain the interquartile range using MINITAB software:
- Choose Stat > Basic Statistics > Display Descriptive Statistics.
- In Variables, enter the columns Percentage_Democrats.
- Check Options, Select Interquartile range.
- Click OK in all dialogue boxes.
Output obtained using the MINITAB software is given below:
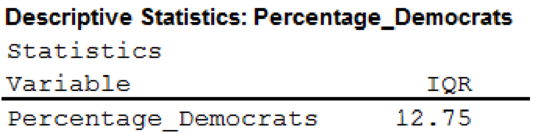
From the output, the interquartile range is 12.75.
b.
Create a table for frequency table with five.
Find the mean and sample standard deviation using the frequency table.
Find the 75% Chebyshev interval centered about the mean.
Answer to Problem 5CRP
The frequency distribution table is given below:
| Class Limits | Midpoints | Frequency |
| 31-38 | 34.5 | 11 |
| 39-46 | 42.5 | 24 |
| 47-54 | 50.5 | 15 |
| 55-62 | 58.5 | 7 |
| 63-70 | 66.5 | 3 |
The value of the sample mean is 46.1.
The sample standard deviation is 8.64.
The 75% Chebyshev interval centered about the mean are between 28.82 and 63.38.
Explanation of Solution
Midpoint:
The midpoint is calculated as given below:
Frequency:
Frequency is the number of data points that fall under each class.
From the given data set, the largest data point is 200 and the smallest data point is 10.
Class Width:
The class width is calculated as follows:
The class width is 8. Hence, the lower class limit for the second class 39 is calculated by adding 8 to 31. Following this pattern, all the lower class limits are established. Then, the upper class limits are calculated.
The frequency distribution table is given below:
| Class Limits | Midpoints | Frequency |
| 31-38 | 34.5 | 11 |
| 39-46 | 42.5 | 24 |
| 47-54 | 50.5 | 15 |
| 55-62 | 58.5 | 7 |
| 63-70 | 66.5 | 3 |
The formula for the sample mean, the sample variance, and the sample standard deviation for grouped data is given below:
Where, x is the midpoint,
The midpoint and the frequency is obtained from the histogram.
The value of
| Midpoint (x) | Frequency (f) | xf |
| 34.5 | 11 | 379.5 |
| 42.5 | 24 | 1020 |
| 50.5 | 15 | 757.5 |
| 58.5 | 7 | 409.5 |
| 66.5 | 3 | 199.5 |
The value of sample mean is obtained below:
Thus, the value of the sample mean is 46.1.
The value of
| Midpoint (x) | Frequency (f) | |||
| 34.5 | 11 | –11.6 | 134.56 | 1,480.16 |
| 42.5 | 24 | –3.6 | 12.96 | 311.04 |
| 50.5 | 15 | 4.4 | 19.36 | 290.4 |
| 58.5 | 7 | 12.4 | 153.76 | 1,076.32 |
| 66.5 | 3 | 20.4 | 416.16 | 1,248.48 |
The sample standard deviation is obtained below:
Thus, the sample standard deviation is 8.64.
The 75% Chebyshev interval centered on the mean is obtained below:
Thus, the 75% Chebyshev interval centered about the mean are between 28.82 and 63.38.
c.
Find the actual sample mean and sample standard deviation using statistical computer.
Answer to Problem 5CRP
The value of actual sample mean is 46.15.
The value of sample standard deviation is 8.63.
Explanation of Solution
Step-by-step procedure to obtain the mean and standard deviation using MINITAB software:
- Choose Stat > Basic Statistics > Display Descriptive Statistics.
- In Variables enter the columns Percentage_Democrats.
- Check Options, Select Mean, and standard deviation.
- Click OK in all dialogue boxes.
Output obtained using the MINITAB software is given below:
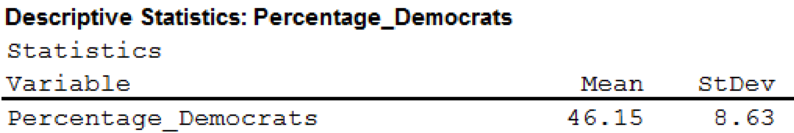
From the MINITAB output, the value of actual sample mean is 46.15 and the value of sample standard deviation is 8.63.
Want to see more full solutions like this?
Chapter 3 Solutions
UNDERSTANDABLE STATISTICS(LL)/ACCESS


- Suppose that the chance that an elementary student eats hot lunch is 30 percent. What’s the chance that, among 20 randomly selected students, between 6 and 8 students eat hot lunch (inclusive)?arrow_forwardBob’s commuting times to work are varied. He makes it to work on time 80 percent of the time. On 12 randomly selected trips to work, what’s the chance that Bob makes it on time at least 10 times?arrow_forwardYour chance of winning a small prize in a scratch-off ticket is 10 percent. You buy five tickets. What’s the chance you will win at least one prize?arrow_forward
- Suppose that 60 percent of families own a pet. You randomly sample four families. What is the chance that two or three of them own a pet?arrow_forwardIf 40 percent of university students purchase their textbooks online, in a random sample of five students, what’s the chance that exactly one of them purchased their textbooks online?arrow_forwardA stoplight is green 40 percent of the time. If you stop at this light eight random times, what is the chance that it’s green exactly five times?arrow_forward
- If 10 percent of the parts made by a certain company are defective and have to be remade, what is the chance that a random sample of four parts has one that is defective?arrow_forwardQuestion 4 Fourteen individuals were given a complex puzzle to complete. The times in seconds was recorded for their first and second attempts and the results provided below: 1 2 3 first attempt 172 255 second attempt 70 4 5 114 248 218 194 270 267 66 6 7 230 219 341 174 8 10 9 210 261 347 218 200 281 199 308 268 243 236 300 11 12 13 14 140 302 a. Calculate a 95% confidence interval for the mean time taken by each individual to complete the (i) first attempt and (ii) second attempt. [la] b. Test the hypothesis that the difference between the two mean times for both is 100 seconds. Use the 5% level of significance. c. Subsequently, it was learnt that the times for the second attempt were incorrecly recorded and that each of the values is 50 seconds too large. What, if any, difference does this make to the results of the test done in part (b)? Show all steps for the hypothesis testarrow_forwardQuestion 3 3200 students were asked about the importance of study groups in successfully completing their courses. They were asked to provide their current majors as well as their opinion. The results are given below: Major Opinion Psychology Sociology Economics Statistics Accounting Total Agree 144 183 201 271 251 1050 Disagree 230 233 254 227 218 1162 Impartial 201 181 196 234 176 988 Total 575 597 651 732 645 3200 a. State both the null and alternative hypotheses. b. Provide the decision rule for making this decision. Use an alpha level of 5%. c. Show all of the work necessary to calculate the appropriate statistic. | d. What conclusion are you allowed to draw? c. Would your conclusion change at the 10% level of significance? f. Confirm test results in part (c) using JASP. Note: All JASP input files and output tables should be providedarrow_forward
- Question 1 A tech company has acknowledged the importance of having records of all meetings conducted. The meetings are very fast paced and requires equipment that is able to capture the information in the shortest possible time. There are two options, using a typewriter or a word processor. Fifteen administrative assistants are selected and the amount of typing time in hours was recorded. The results are given below: 1 2 3 4 5 6 7 8 9 10 11 12 13 14 15 typewriter 8.0 6.5 5.0 6.7 7.8 8.5 7.2 5.7 9.2 5.7 6.5 word processor 7.2 5.7 8.3 7.5 9.2 7.2 6.5 7.0 6.9 34 7.0 6.9 8.8 6.7 8.8 9.4 8.6 5.5 7.2 8.4 a. Test the hypothesis that the mean typing time in hours for typewriters is less than 7.0. Use the 1% level of significance. b. Construct a 90% confidence interval for the difference in mean typing time in hours, where a difference is equal to the typing time in hours of word processors minus typing time in hours of typewriter. c. Using the 5% significance level, determine whether there is…arrow_forwardIllustrate 2/7×4/5 using a rectangular region. Explain your work. arrow_forwardWrite three other different proportions equivalent to the following using the same values as in the given proportion 3 foot over 1 yard equals X feet over 5 yardsarrow_forward
 Holt Mcdougal Larson Pre-algebra: Student Edition...AlgebraISBN:9780547587776Author:HOLT MCDOUGALPublisher:HOLT MCDOUGAL
 Big Ideas Math A Bridge To Success Algebra 1: Stu...AlgebraISBN:9781680331141Author:HOUGHTON MIFFLIN HARCOURTPublisher:Houghton Mifflin Harcourt
 Glencoe Algebra 1, Student Edition, 9780079039897...AlgebraISBN:9780079039897Author:CarterPublisher:McGraw Hill
 Functions and Change: A Modeling Approach to Coll...AlgebraISBN:9781337111348Author:Bruce Crauder, Benny Evans, Alan NoellPublisher:Cengage Learning