
Intro Stats
4th Edition
ISBN: 9780321825278
Author: Richard D. De Veaux, Paul F. Velleman, David E. Bock
Publisher: PEARSON
expand_more
expand_more
format_list_bulleted
Concept explainers
Videos
Textbook Question
Chapter 3, Problem 56E
ZIP codes revisited Here are some summary statistics to go with the histogram of the ZIP codes of 500 customers from the Holes-R-Us Internet Jewelry Salon that we saw in Exercise 81:
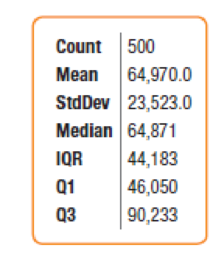
What can these statistics tell you about the company’s sales?
Expert Solution & Answer
Want to see the full answer?
Check out a sample textbook solution
Students have asked these similar questions
NC Current Students - North Ce X | NC Canvas Login Links - North ( X
Final Exam Comprehensive x Cengage Learning
x
WASTAT - Final Exam - STAT
→
C
webassign.net/web/Student/Assignment-Responses/submit?dep=36055360&tags=autosave#question3659890_9
Part (b)
Draw a scatter plot of the ordered pairs.
N
Life
Expectancy
Life
Expectancy
80
70
600
50
40
30
20
10
Year of
1950
1970 1990
2010 Birth
O
Life
Expectancy
Part (c)
800
70
60
50
40
30
20
10
1950
1970 1990
W
ALT
林
$
#
4
R
J7
Year of
2010 Birth
F6
4+
80
70
60
50
40
30
20
10
Year of
1950 1970 1990
2010 Birth
Life
Expectancy
Ox
800
70
60
50
40
30
20
10
Year of
1950 1970 1990 2010 Birth
hp
P.B.
KA
&
7
80
% 5
H
A
B
F10
711
N
M
K
744
PRT SC
ALT
CTRL
Harvard University
California Institute of Technology
Massachusetts Institute of Technology
Stanford University
Princeton University
University of Cambridge
University of Oxford
University of California, Berkeley
Imperial College London
Yale University
University of California, Los Angeles
University of Chicago
Johns Hopkins University
Cornell University
ETH Zurich
University of Michigan
University of Toronto
Columbia University
University of Pennsylvania
Carnegie Mellon University
University of Hong Kong
University College London
University of Washington
Duke University
Northwestern University
University of Tokyo
Georgia Institute of Technology
Pohang University of Science and Technology
University of California, Santa Barbara
University of British Columbia
University of North Carolina at Chapel Hill
University of California, San Diego
University of Illinois at Urbana-Champaign
National University of Singapore
McGill…
Name
Harvard University
California Institute of Technology
Massachusetts Institute of Technology
Stanford University
Princeton University
University of Cambridge
University of Oxford
University of California, Berkeley
Imperial College London
Yale University
University of California, Los Angeles
University of Chicago
Johns Hopkins University
Cornell University
ETH Zurich
University of Michigan
University of Toronto
Columbia University
University of Pennsylvania
Carnegie Mellon University
University of Hong Kong
University College London
University of Washington
Duke University
Northwestern University
University of Tokyo
Georgia Institute of Technology
Pohang University of Science and Technology
University of California, Santa Barbara
University of British Columbia
University of North Carolina at Chapel Hill
University of California, San Diego
University of Illinois at Urbana-Champaign
National University of Singapore…
Chapter 3 Solutions
Intro Stats
Ch. 3.2 - Prob. 1JCCh. 3.2 - Prob. 2JCCh. 3.2 - Prob. 3JCCh. 3.2 - Prob. 4JCCh. 3.2 - Prob. 5JCCh. 3.7 - The U.S. Census Bureau reports the median family...Ch. 3.7 - Prob. 7JCCh. 3.7 - Prob. 8JCCh. 3 - Prob. 1ECh. 3 - 2. Opposites In a way, boxplots are the opposite...
Ch. 3 - Prob. 3ECh. 3 - Prob. 4ECh. 3 - Prob. 5ECh. 3 - Prob. 6ECh. 3 - Prob. 7ECh. 3 - Prob. 8ECh. 3 - Thinking about shape Would you expect...Ch. 3 - More shapes Would you expect distributions of...Ch. 3 - Prob. 15ECh. 3 - Prob. 16ECh. 3 - Prob. 17ECh. 3 - Run times One of the authors collected the times...Ch. 3 - Heart attack stays The histogram shows the lengths...Ch. 3 - 20. E-mails A university teacher saved every...Ch. 3 - Prob. 21ECh. 3 - Prob. 22ECh. 3 - Prob. 23ECh. 3 - Prob. 24ECh. 3 - Mistake A clerk entering salary data into a...Ch. 3 - Prob. 26ECh. 3 - Prob. 27ECh. 3 - Prob. 28ECh. 3 - Pizza prices The histogram shows the distribution...Ch. 3 - Neck size The histogram shows the neck sizes (in...Ch. 3 - Pizza prices again Look again at the histogram of...Ch. 3 - Neck sizes again Look again at the histogram of...Ch. 3 - Movie lengths 2010 The histogram shows the running...Ch. 3 - 34. Golf drives 2011 The display shows the average...Ch. 3 - Prob. 35ECh. 3 - Prob. 36ECh. 3 - Prob. 37ECh. 3 - Cold weather A meteorologist preparing a talk...Ch. 3 - Prob. 39ECh. 3 - Prob. 40ECh. 3 - Prob. 41ECh. 3 - The great one During his 20 seasons in the NHL,...Ch. 3 - Prob. 43ECh. 3 - Prob. 44ECh. 3 - Prob. 45ECh. 3 - Prob. 46ECh. 3 - Prob. 47ECh. 3 - Prob. 48ECh. 3 - Prob. 49ECh. 3 - Prob. 50ECh. 3 - Prob. 51ECh. 3 - Prob. 52ECh. 3 - Prob. 53ECh. 3 - Prob. 54ECh. 3 - Prob. 55ECh. 3 - ZIP codes revisited Here are some summary...Ch. 3 - Prob. 57ECh. 3 - Prob. 58ECh. 3 - Prob. 59ECh. 3 - Prob. 60E
Additional Math Textbook Solutions
Find more solutions based on key concepts
For Exercises 13–18, write the negation of the statement.
13. The cell phone is out of juice.
Math in Our World
(a) Make a stem-and-leaf plot for these 24 observations on the number of customers who used a down-town CitiBan...
APPLIED STAT.IN BUS.+ECONOMICS
Silvia wants to mix a 40% apple juice drink with pure apple juice to make 2 L of a juice drink that is 80% appl...
Beginning and Intermediate Algebra
The first derivative of function y=25x4.
Calculus for Business, Economics, Life Sciences, and Social Sciences (14th Edition)
Is there a relationship between wine consumption and deaths from heart disease? The table gives data from 19 de...
College Algebra Essentials (5th Edition)
Knowledge Booster


Learn more about
Need a deep-dive on the concept behind this application? Look no further. Learn more about this topic, statistics and related others by exploring similar questions and additional content below.Similar questions
- A company found that the daily sales revenue of its flagship product follows a normal distribution with a mean of $4500 and a standard deviation of $450. The company defines a "high-sales day" that is, any day with sales exceeding $4800. please provide a step by step on how to get the answers in excel Q: What percentage of days can the company expect to have "high-sales days" or sales greater than $4800? Q: What is the sales revenue threshold for the bottom 10% of days? (please note that 10% refers to the probability/area under bell curve towards the lower tail of bell curve) Provide answers in the yellow cellsarrow_forwardFind the critical value for a left-tailed test using the F distribution with a 0.025, degrees of freedom in the numerator=12, and degrees of freedom in the denominator = 50. A portion of the table of critical values of the F-distribution is provided. Click the icon to view the partial table of critical values of the F-distribution. What is the critical value? (Round to two decimal places as needed.)arrow_forwardA retail store manager claims that the average daily sales of the store are $1,500. You aim to test whether the actual average daily sales differ significantly from this claimed value. You can provide your answer by inserting a text box and the answer must include: Null hypothesis, Alternative hypothesis, Show answer (output table/summary table), and Conclusion based on the P value. Showing the calculation is a must. If calculation is missing,so please provide a step by step on the answers Numerical answers in the yellow cellsarrow_forward
arrow_back_ios
SEE MORE QUESTIONS
arrow_forward_ios
Recommended textbooks for you
 Holt Mcdougal Larson Pre-algebra: Student Edition...AlgebraISBN:9780547587776Author:HOLT MCDOUGALPublisher:HOLT MCDOUGAL
 Glencoe Algebra 1, Student Edition, 9780079039897...AlgebraISBN:9780079039897Author:CarterPublisher:McGraw Hill
 Functions and Change: A Modeling Approach to Coll...AlgebraISBN:9781337111348Author:Bruce Crauder, Benny Evans, Alan NoellPublisher:Cengage Learning
 Big Ideas Math A Bridge To Success Algebra 1: Stu...AlgebraISBN:9781680331141Author:HOUGHTON MIFFLIN HARCOURTPublisher:Houghton Mifflin Harcourt
Holt Mcdougal Larson Pre-algebra: Student Edition...
Algebra
ISBN:9780547587776
Author:HOLT MCDOUGAL
Publisher:HOLT MCDOUGAL
Glencoe Algebra 1, Student Edition, 9780079039897...
Algebra
ISBN:9780079039897
Author:Carter
Publisher:McGraw Hill
Functions and Change: A Modeling Approach to Coll...
Algebra
ISBN:9781337111348
Author:Bruce Crauder, Benny Evans, Alan Noell
Publisher:Cengage Learning
Big Ideas Math A Bridge To Success Algebra 1: Stu...
Algebra
ISBN:9781680331141
Author:HOUGHTON MIFFLIN HARCOURT
Publisher:Houghton Mifflin Harcourt
The Shape of Data: Distributions: Crash Course Statistics #7; Author: CrashCourse;https://www.youtube.com/watch?v=bPFNxD3Yg6U;License: Standard YouTube License, CC-BY
Shape, Center, and Spread - Module 20.2 (Part 1); Author: Mrmathblog;https://www.youtube.com/watch?v=COaid7O_Gag;License: Standard YouTube License, CC-BY
Shape, Center and Spread; Author: Emily Murdock;https://www.youtube.com/watch?v=_YyW0DSCzpM;License: Standard Youtube License