
Concept explainers
a)
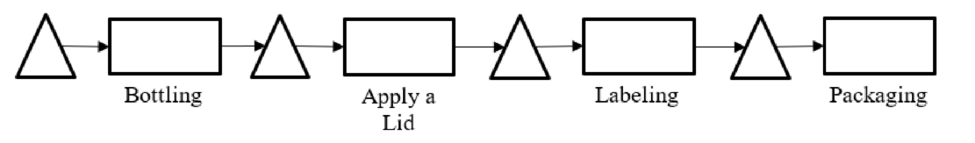
To draw: A process flow diagram for this process.
a)
Explanation of Solution
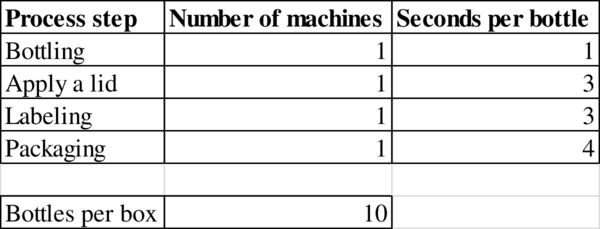
Given information:

Process flow diagram:
b)
To determine: The capacity at the resource “Apply a lid”.
b)
Explanation of Solution
Given information:

Calculation of capacity:
The capacity is 1,200 bottles.
c)
To determine: The bottleneck in the process.
c)
Explanation of Solution
Given information:

Determination of bottleneck:
The process step with the longest processing time “seconds per bottle” is the bottleneck in the process. Packaging has the highest time of 3 seconds per bottle.
Hence, the bottleneck is Packaging.
d)
To determine: The flow rate.
d)
Explanation of Solution
Given information:

Determination of flow rate:
The flow rate is 900 bottles.
e)
To determine: The utilization of resource “Apply a lid”
e)
Explanation of Solution
Given information:

Calculation of utilization:
The utilization is 75%.
f)
To determine: The utilization of bottling.
f)
Explanation of Solution
Given information:
Calculation of utilization:
The utilization is 20%.
g)
To determine: The cycle time of the process.
g)
Explanation of Solution
Given information:

Calculation of cycle time:
The demand is constrained and has a flow rate of
The cycle time is 5 seconds.
h)
To determine: The time taken to produce 500 bottles.
h)
Explanation of Solution
Given information:

Calculation of time taken to produce 500 bottles:
The time taken to produce 500 bottles is 2,515 seconds.
Want to see more full solutions like this?
Chapter 3 Solutions
OPERATIONS MANAGEMENT LL W/CONNECT CODE


- Note: In chapter 9, section 9.4 of the Stevenson text, the costs of quality are covered; chapter 9 Stevenson lecture power point slide 7 touches upon this topic; see lecture video, 3.55 mins to 4.54 mins. 2) The production process at Hansa Ceylon Coffee fills boxes with dark arabica coffee. The data for the fill weight (in ounces) of eight samples are presented below. A sample size of six was used. The firm’s operations analyst wants to construct X-bar and R-charts to monitor the filling process. Sample Sample Mean Sample Range 1 15.80 0.42 2 16.10 0.38 3 16.02 0.08 4 15.95 0.15 5 16.12 0.42 6 16.18 0.23 7 15.87 0.36 8 16.20 0.40 a) Calculate the upper and lower control limits for the X-bar chart. b) Calculate the upper and lower control limits for the R chart. c) Is the process under control? Why or why not? Note: In chapter 10, section 10.3 of the Stevenson text, control charts for variables are…arrow_forwardDo the inherent differences between private and public sector objectives—profit versus publicgood—render private sector category management practices unsuitable for public sectorpurchasing, where open tendering is the norm?You have now undergone the Category Management classes and your superiors have requestedfor your input on how to integrate some of the learnings into the public sector policy. Discuss and elaborate what are the activities and governance you would introduce in yourrecommendations without violating the principle of transparency and accountability withinyour organisation. This is based on Singapore context. Pls provide a draft with explanation, examples and useful links for learning purposes. Citations will be good too. This is a module in SUSS called category management and supplier evaluationarrow_forwardTravelling and working internationally can lead to a life of adventure and unique career experiences. For businesses, selecting the right candidates to take on foreign assignments can propel, delay, or deny the success of the international ventures. As an international manager, identify key competencies you would look for in choosing expatriates. What might be some of their concerns in taking on overseas assignments? What are some best practices in supporting expats during and after their assignments?arrow_forward
- Travelling and working internationally can lead to a life of adventure and unique career experiences. For businesses, selecting the right candidates to take on foreign assignments can propel, delay, or deny the success of the international ventures. As an international manager, identify key competencies you would look for in choosing expatriates. What might be some of their concerns in taking on overseas assignments? What are some best practices in supporting expats during and after their assignments?arrow_forwardI need answer typing clear urjent no chatgpt used pls i will give 5 Upvotes.arrow_forwardI need answer typing clear urjent no chatgpt used pls i will give 5 Upvotes. Pls full explanationarrow_forward
- Cariveh Co sells automotive supplies from 25 different locations in one country. Each branch has up to 30 staff working there, although most of the accounting systems are designed and implemented from the company's head office. All accounting systems, apart from petty cash, are computerised, with the internal audit department frequently advising and implementing controls within those systems. Cariveh has an internal audit department of six staff, all of whom have been employed at Cariveh for a minimum of five years and some for as long as 15 years. In the past, the chief internal auditor appoints staff within the internal audit department, although the chief executive officer (CEO) is responsible for appointing the chief internal auditor. The chief internal auditor reports directly to the finance director. The finance director also assists the chief internal auditor in deciding on the scope of work of the internal audit department. You are an audit manager in the internal audit…arrow_forwardCariveh Co sells automotive supplies from 25 different locations in one country. Each branch has up to 30 staff working there, although most of the accounting systems are designed and implemented from the company's head office. All accounting systems, apart from petty cash, are computerised, with the internal audit department frequently advising and implementing controls within those systems. Cariveh has an internal audit department of six staff, all of whom have been employed at Cariveh for a minimum of five years and some for as long as 15 years. In the past, the chief internal auditor appoints staff within the internal audit department, although the chief executive officer (CEO) is responsible for appointing the chief internal auditor. The chief internal auditor reports directly to the finance director. The finance director also assists the chief internal auditor in deciding on the scope of work of the internal audit department. You are an audit manager in the internal audit…arrow_forwardPlease show all steps and answers, thank you!arrow_forward
- I am not sure if this is correct, because 8 cannot go directly to 10.arrow_forwardA practical application in real life to the Critical Path Method is the construction of a bridge with references, give a detailed essay on the stages involved in constructing a bridgearrow_forwardPlease assist in writing a complete reasearch project of the following title: Title of research: Study on the impact of Technology in the Work Place.arrow_forward

 Practical Management ScienceOperations ManagementISBN:9781337406659Author:WINSTON, Wayne L.Publisher:Cengage,