
Subpart (a):
Demand and supply.
Subpart (a):
Answer to Problem 4P
Explanation of Solution
When the supply decreases with constant demand curve, it will lead to a decrease in the equilibrium quantity and an increase in the
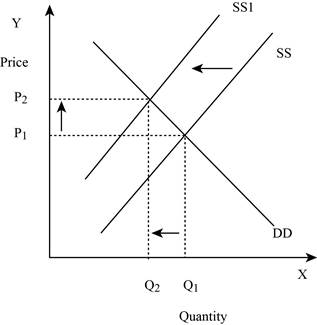
Figure -1
In Figure -1, the horizontal axis measures the quantity supplied and the vertical axis measures the price of the balls. ‘DD’ represents the demand and the demand curve shifts from DD to DD1; ‘SS’ represents the supply curve and the supply curve shifts from SS to SS1. Decrease in supply will lead to a decrease in the equilibrium quantity from ‘Q1 to Q2’ and an increase in the equilibrium price from ‘P1 to P2’.
Concept introduction:
Demand: Demand refers to the total value of the goods and services that are demanded at a particular price in the given period of time.
Supply: Supply refers to the total value of the goods and services that are available for purchase at a particular price in the given period of time.
Subpart (b):
Demand and supply.
Subpart (b):
Answer to Problem 4P
Price shifts down and quantity shifts down – b.
Explanation of Solution
When the demand decreases with constant supply curve, it will lead to a decrease in the equilibrium quantity and equilibrium price. This is shown below in Figure -2:
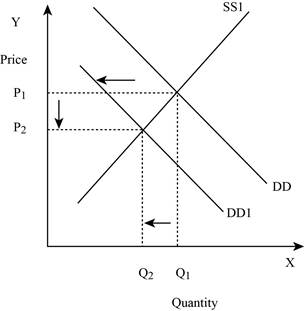
Figure -2
In Figure -2, the horizontal axis measures the quantity supplied and the vertical axis measures the price of the balls. ‘DD’ represents the demand and the demand curve shifts to the left from DD to DD1; ‘SS’ represents the supply curve. Decrease in supply will lead to a decrease in the equilibrium quantity from ‘Q1 to Q2’ and the equilibrium price from ‘P1 to P2’.
Concept introduction:
Demand: Demand refers to the total value of the goods and services that are demanded at a particular price in the given period of time.
Supply: Supply refers to the total value of the goods and services that are available for purchase at a particular price in the given period of time.
Subpart (c):
Demand and supply.
Subpart (c):
Answer to Problem 4P
Price shifts down and quantity shifts up – c.
Explanation of Solution
When the demand is constant with an increase in the supply curve, it will lead to a decrease in the equilibrium price and an increase in the equilibrium quantity. This is shown below in Figure -3:
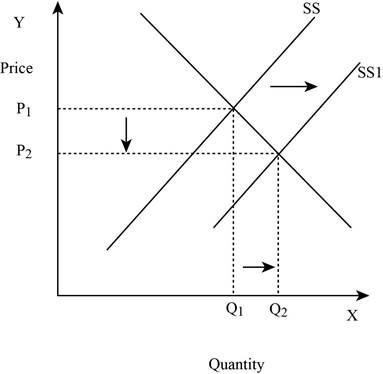
Figure -3
In Figure -3, the horizontal axis measures the quantity supplied and the vertical axis measures the price of the balls. ‘DD’ represents the demand and ‘SS’ represents the supply curve and the supply curve shifts to the right from SS to SS1. Increase in supply will lead to a decrease in the equilibrium price from ‘P1 to P2’ and an increase in the equilibrium quantity from ‘Q1 to Q2’.
Concept introduction:
Demand: Demand refers to the total value of the goods and services that are demanded at a particular price in the given period of time.
Supply: Supply refers to the total value of the goods and services that are available for purchase at a particular price in the given period of time.
Subpart (d):
Demand and supply.
Subpart (d):
Answer to Problem 4P
Price will indeterminate and quantity shifts up – d.
Explanation of Solution
When both the demand and supply increases, it will lead to an increase in the equilibrium quantity and the change in price is indeterminate. This is because an increase in the supply puts a downward pressure on the equilibrium price. This is shown below in Figure – 4:
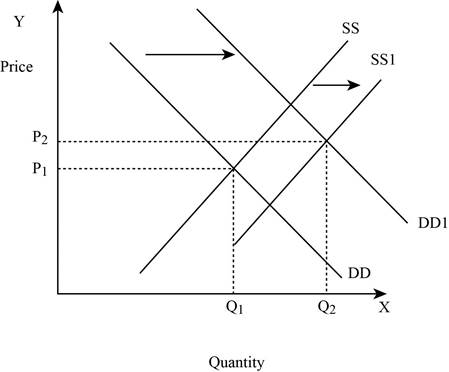
Figure -4
In Figure -4, the horizontal axis measures the quantity supplied and the vertical axis measures the price of the balls. ‘DD’ represents the demand curve and ‘SS’ represents the supply curve. Due to the increase in supply and demand, the supply curve shifts to the right from SS to SS1 and the demand curve shifts from DD to DD1. An increase in the supply leads to an increase in the equilibrium price from ‘P1 to P2’ and the equilibrium quantity from ‘Q1 to Q2’.
Concept introduction:
Demand: Demand refers to the total value of the goods and services that are demanded at a particular price in the given period of time.
Supply: Supply refers to the total value of the goods and services that are available for purchase at a particular price in the given period of time.
Subpart (e):
Demand and supply.
Subpart (e):
Answer to Problem 4P
Price shifts up and quantity shifts up – e.
Explanation of Solution
If the demand increases with constant supply, it leads to an increase in the equilibrium quantity and equilibrium price. This is shown below in Figure – 5:
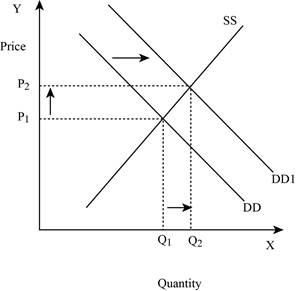
Figure -5
In Figure -5, the horizontal axis measures the quantity supplied and the vertical axis measures the price of the balls. ‘DD’ represents the demand curve and ‘SS’ represents the supply curve. Due to an increase in demand, the demand curve will shift the curve to the right from DD to DD1. An increase in demand will increase the equilibrium price from ‘P1 to P2’ and increases the equilibrium quantity from ‘Q1 to Q2’.
Concept introduction:
Demand: Demand refers to the total value of the goods and services that are demanded at a particular price in the given period of time.
Supply: Supply refers to the total value of the goods and services that are available for purchase at a particular price in the given period of time.
Subpart (f):
Demand and supply.
Subpart (f):
Answer to Problem 4P
Price shifts down and quantity indeterminate – f.
Explanation of Solution
If the supply increases with a decrease in demand, it leads to a decrease in the equilibrium price because both the curves put a pressure on the equilibrium price. Thus, an increase in supply increases the equilibrium quantity and a decrease in demand lead to a decrease in the equilibrium quantity. This is shown below in Figure – 6:
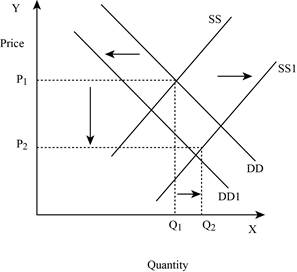
Figure -6
In Figure -6, the horizontal axis measures the quantity supplied and the vertical axis measures the price of the balls. ‘DD’ represents the demand curve and ‘SS’ represents the supply curve. Due to a decrease in demand and an increase in supply, demand curve will shift the curve to the left from DD to DD1. An increase in supply will lead to an increase in the equilibrium quantity from ‘P1 to P2’ and increases the equilibrium quantity from ‘Q1 to Q2’.
Concept introduction:
Demand: Demand refers to the total value of the goods and services that are demanded at a particular price in the given period of time.
Supply: Supply refers to the total value of the goods and services that are available for purchase at a particular price in the given period of time.
Subpart (g):
Demand and supply.
Subpart (g):
Answer to Problem 4P
Price shifts up and quantity indeterminate – g.
Explanation of Solution
If the supply decreases with an increase in demand, it will lead to an increase in the equilibrium price because both the curve put a pressure on the equilibrium price. An increase in demand will lead to an increase in the equilibrium quantity. This is shown below in Figure – 7:
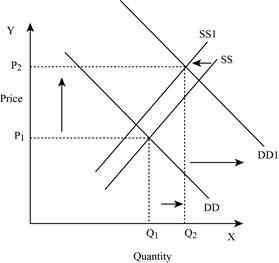
Figure -7
In Figure -7, the horizontal axis measures the quantity supplied and the vertical axis measures the price of the balls. ‘DD’ represents the demand and ‘SS’ represents the supply curve. Due to a decrease in supply and an increase in demand, the supply curve will shift the curve to the left from SS to SS1 and the demand curve shifts the curve to the right, which leads to an increase in the equilibrium price from ‘P1 to P2’ and the equilibrium quantity from ‘Q1 to Q2’.
Concept introduction:
Demand: Demand refers to the total value of the goods and services that are demanded at a particular price in the given period of time.
Supply: Supply refers to the total value of the goods and services that are available for purchase at a particular price in the given period of time.
Subpart (h):
Demand and supply.
Subpart (h):
Answer to Problem 4P
Price indeterminate and quantity shifts down – h.
Explanation of Solution
If both the supply and demand decreases, then it lead to a decrease in the equilibrium quantity and the change in equilibrium price is indeterminate. This is because a decrease in supply puts an upward pressure on the equilibrium price. This is shown below in Figure – 8:
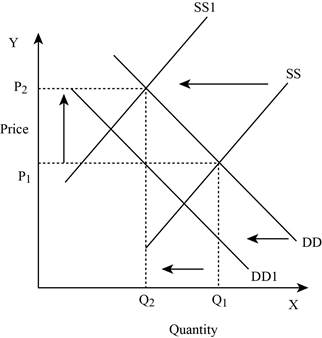
Figure -8
In Figure -8, the horizontal axis measures the quantity supplied and the vertical axis measures the price of the balls. ‘DD’ represents the demand and ‘SS’ represents the supply curve. Due to a decrease in supply and a decrease in demand, the supply curve will shift the curve to the left from SS to SS1 and the demand curve shifts the curve to the left, which lead to an increase in the equilibrium price from ‘P1 to P2’ and a decrease in the equilibrium quantity from ‘Q1 to Q2’.
Concept introduction:
Demand: Demand refers to the total value of the goods and services that are demanded at a particular price in the given period of time.
Supply: Supply refers to the total value of the goods and services that are available for purchase at a particular price in the given period of time.
Want to see more full solutions like this?
Chapter 3 Solutions
Microeconomics

- Critically analyse the five (5) characteristics of Ubuntu and provide examples of how they apply to the National Health Insurance (NHI) in South Africa.arrow_forwardCritically analyse the five (5) characteristics of Ubuntu and provide examples of how they apply to the National Health Insurance (NHI) in South Africa.arrow_forwardOutline the nine (9) consumer rights as specified in the Consumer Rights Act in South Africa.arrow_forward
- In what ways could you show the attractiveness of Philippines in the form of videos/campaigns to foreign investors? Cite 10 examples.arrow_forwardExplain the following terms and provide an example for each term: • Corruption • Fraud • Briberyarrow_forwardIn what ways could you show the attractiveness of a country in the form of videos/campaigns?arrow_forward
 Brief Principles of Macroeconomics (MindTap Cours...EconomicsISBN:9781337091985Author:N. Gregory MankiwPublisher:Cengage Learning
 Principles of MicroeconomicsEconomicsISBN:9781305156050Author:N. Gregory MankiwPublisher:Cengage Learning
 Essentials of Economics (MindTap Course List)EconomicsISBN:9781337091992Author:N. Gregory MankiwPublisher:Cengage Learning
 Principles of Economics (MindTap Course List)EconomicsISBN:9781305585126Author:N. Gregory MankiwPublisher:Cengage Learning
 Principles of Microeconomics (MindTap Course List)EconomicsISBN:9781305971493Author:N. Gregory MankiwPublisher:Cengage Learning