Subpart (a):
Demand and supply.
Subpart (a):
Answer to Problem 4P
Explanation of Solution
When the supply decreases with constant demand curve, it will lead to a decrease in the
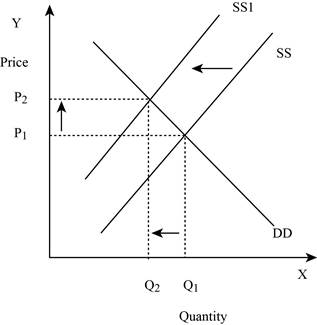
Figure -1
In Figure -1, the horizontal axis measures the quantity supplied and the vertical axis measures the price of the balls. ‘DD’ represents the demand and the demand curve shifts from DD to DD1; ‘SS’ represents the supply curve and the supply curve shifts from SS to SS1. Decrease in supply will lead to a decrease in the equilibrium quantity from ‘Q1 to Q2’ and an increase in the equilibrium price from ‘P1 to P2’.
Concept introduction:
Demand: Demand refers to the total value of the goods and services that are demanded at a particular price in the given period of time.
Supply: Supply refers to the total value of the goods and services that are available for purchase at a particular price in the given period of time.
Subpart (b):
Demand and supply.
Subpart (b):
Answer to Problem 4P
Price shifts down and quantity shifts down – b.
Explanation of Solution
When the demand decreases with constant supply curve, it will lead to a decrease in the equilibrium quantity and equilibrium price. This is shown below in Figure -2:
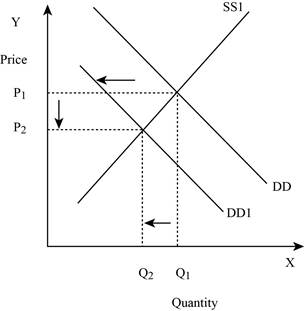
Figure -2
In Figure -2, the horizontal axis measures the quantity supplied and the vertical axis measures the price of the balls. ‘DD’ represents the demand and the demand curve shifts to the left from DD to DD1; ‘SS’ represents the supply curve. Decrease in supply will lead to a decrease in the equilibrium quantity from ‘Q1 to Q2’ and the equilibrium price from ‘P1 to P2’.
Concept introduction:
Demand: Demand refers to the total value of the goods and services that are demanded at a particular price in the given period of time.
Supply: Supply refers to the total value of the goods and services that are available for purchase at a particular price in the given period of time.
Subpart (c):
Demand and supply.
Subpart (c):
Answer to Problem 4P
Price shifts down and quantity shifts up – c.
Explanation of Solution
When the demand is constant with an increase in the supply curve, it will lead to a decrease in the equilibrium price and an increase in the equilibrium quantity. This is shown below in Figure -3:
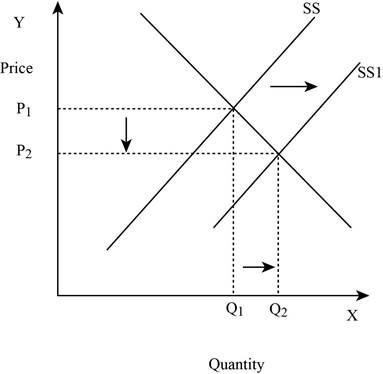
Figure -3
In Figure -3, the horizontal axis measures the quantity supplied and the vertical axis measures the price of the balls. ‘DD’ represents the demand and ‘SS’ represents the supply curve and the supply curve shifts to the right from SS to SS1. Increase in supply will lead to a decrease in the equilibrium price from ‘P1 to P2’ and an increase in the equilibrium quantity from ‘Q1 to Q2’.
Concept introduction:
Demand: Demand refers to the total value of the goods and services that are demanded at a particular price in the given period of time.
Supply: Supply refers to the total value of the goods and services that are available for purchase at a particular price in the given period of time.
Subpart (d):
Demand and supply.
Subpart (d):
Answer to Problem 4P
Price will indeterminate and quantity shifts up – d.
Explanation of Solution
When both the demand and supply increases, it will lead to an increase in the equilibrium quantity and the change in price is indeterminate. This is because an increase in the supply puts a downward pressure on the equilibrium price. This is shown below in Figure – 4:
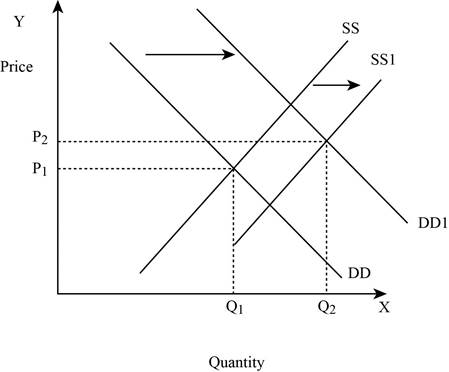
Figure -4
In Figure -4, the horizontal axis measures the quantity supplied and the vertical axis measures the price of the balls. ‘DD’ represents the demand curve and ‘SS’ represents the supply curve. Due to the increase in supply and demand, the supply curve shifts to the right from SS to SS1 and the demand curve shifts from DD to DD1. An increase in the supply leads to an increase in the equilibrium price from ‘P1 to P2’ and the equilibrium quantity from ‘Q1 to Q2’.
Concept introduction:
Demand: Demand refers to the total value of the goods and services that are demanded at a particular price in the given period of time.
Supply: Supply refers to the total value of the goods and services that are available for purchase at a particular price in the given period of time.
Subpart (e):
Demand and supply.
Subpart (e):
Answer to Problem 4P
Price shifts up and quantity shifts up – e.
Explanation of Solution
If the demand increases with constant supply, it leads to an increase in the equilibrium quantity and equilibrium price. This is shown below in Figure – 5:
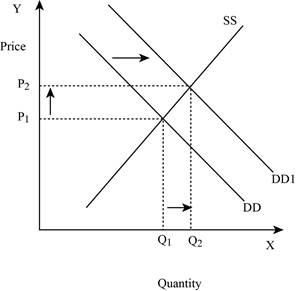
Figure -5
In Figure -5, the horizontal axis measures the quantity supplied and the vertical axis measures the price of the balls. ‘DD’ represents the demand curve and ‘SS’ represents the supply curve. Due to an increase in demand, the demand curve will shift the curve to the right from DD to DD1. An increase in demand will increase the equilibrium price from ‘P1 to P2’ and increases the equilibrium quantity from ‘Q1 to Q2’.
Concept introduction:
Demand: Demand refers to the total value of the goods and services that are demanded at a particular price in the given period of time.
Supply: Supply refers to the total value of the goods and services that are available for purchase at a particular price in the given period of time.
Subpart (f):
Demand and supply.
Subpart (f):
Answer to Problem 4P
Price shifts down and quantity indeterminate – f.
Explanation of Solution
If the supply increases with a decrease in demand, it leads to a decrease in the equilibrium price because both the curves put a pressure on the equilibrium price. Thus, an increase in supply increases the equilibrium quantity and a decrease in demand lead to a decrease in the equilibrium quantity. This is shown below in Figure – 6:
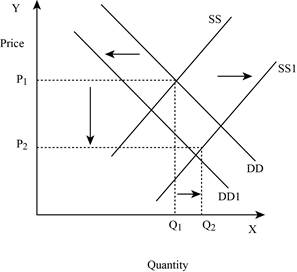
Figure -6
In Figure -6, the horizontal axis measures the quantity supplied and the vertical axis measures the price of the balls. ‘DD’ represents the demand curve and ‘SS’ represents the supply curve. Due to a decrease in demand and an increase in supply, demand curve will shift the curve to the left from DD to DD1. An increase in supply will lead to an increase in the equilibrium quantity from ‘P1 to P2’ and increases the equilibrium quantity from ‘Q1 to Q2’.
Concept introduction:
Demand: Demand refers to the total value of the goods and services that are demanded at a particular price in the given period of time.
Supply: Supply refers to the total value of the goods and services that are available for purchase at a particular price in the given period of time.
Subpart (g):
Demand and supply.
Subpart (g):
Answer to Problem 4P
Price shifts up and quantity indeterminate – g.
Explanation of Solution
If the supply decreases with an increase in demand, it will lead to an increase in the equilibrium price because both the curve put a pressure on the equilibrium price. An increase in demand will lead to an increase in the equilibrium quantity. This is shown below in Figure – 7:
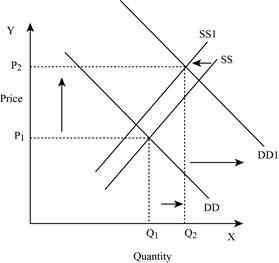
Figure -7
In Figure -7, the horizontal axis measures the quantity supplied and the vertical axis measures the price of the balls. ‘DD’ represents the demand and ‘SS’ represents the supply curve. Due to a decrease in supply and an increase in demand, the supply curve will shift the curve to the left from SS to SS1 and the demand curve shifts the curve to the right, which leads to an increase in the equilibrium price from ‘P1 to P2’ and the equilibrium quantity from ‘Q1 to Q2’.
Concept introduction:
Demand: Demand refers to the total value of the goods and services that are demanded at a particular price in the given period of time.
Supply: Supply refers to the total value of the goods and services that are available for purchase at a particular price in the given period of time.
Subpart (h):
Demand and supply.
Subpart (h):
Answer to Problem 4P
Price indeterminate and quantity shifts down – h.
Explanation of Solution
If both the supply and demand decreases, then it lead to a decrease in the equilibrium quantity and the change in equilibrium price is indeterminate. This is because a decrease in supply puts an upward pressure on the equilibrium price. This is shown below in Figure – 8:
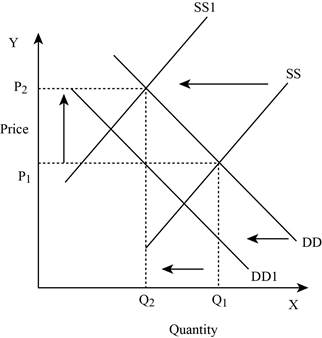
Figure -8
In Figure -8, the horizontal axis measures the quantity supplied and the vertical axis measures the price of the balls. ‘DD’ represents the demand and ‘SS’ represents the supply curve. Due to a decrease in supply and a decrease in demand, the supply curve will shift the curve to the left from SS to SS1 and the demand curve shifts the curve to the left, which lead to an increase in the equilibrium price from ‘P1 to P2’ and a decrease in the equilibrium quantity from ‘Q1 to Q2’.
Concept introduction:
Demand: Demand refers to the total value of the goods and services that are demanded at a particular price in the given period of time.
Supply: Supply refers to the total value of the goods and services that are available for purchase at a particular price in the given period of time.
Want to see more full solutions like this?
Chapter 3 Solutions
EBK MICROECONOMICS

- 1. The table below shows a country's hypothetical national income and product accounts data. Category Consumption (personal consumption expenditures) Investment (gross private domestic investment) Government consumption (government expenditures) Exports Imports Net Factor Income from Abroad Net unilateral transfers Billions of Dollars 8,000 1,300 2,100 900 1,750 +45 -20 a. Compute the following accounts using the information in the table: Gross national expenditure (GNE) . Trade balance (TB) • Gross domestic product (GDP) • Gross national income (GNI) . Gross national disposable income (GNDI) Current account (CA) b. Derive the current account identity using the national income identity. Are savings greater than or smaller than investment in this country? The national income identity is: GNDIGNE + CA, GNE = C + G + I.arrow_forward4. Assume that a country produces an output Q of 50 every year. The world interest rate is 10%. Consumption C is 50 every year, and I = G = 0. There is an unexpected drop in output in year 0, so output falls to 28 and is then expected to return to 50 in every future year. If the country desires to smooth consumption, how much should it borrow in period 0? What will the new level of consumption be from then on?arrow_forward2. Show how each of the following would affect the following US balance of payments: trade balance (TB), net factor income abroad (NFIA), net unilateral transfers (NUT), financial account (FA), and capital account (KA). Identify which specific account is affected in each case (e.g., +$10 in TB). Note that the sum of the balance of payment accounts is zero. Example: A California computer manufacturer purchases a $50 hard disk from a Malaysian company, paying the funds from a bank account in Malaysia. Answer: The US imports a hard disk from Malaysia: TB = $50 The US draws a foreign asset to pay for the import (less external asset): FA = +$50. (Note: The balance of payment identity holds: CA + FA (+KA) = −- $50 + $50 = 0. No KA in this example.) a. A US tourist in Japan sells his iPod to a local resident for yen worth $100. (hint: A US tourist obtains Japanese currency.) b. A US owner of Honda shares receives $10,000 in dividend payments, which are paid into a Tokyo bank. c. The central…arrow_forward
- Mark's Pizza Enter George's Pizza Stay Out Advertise $50, -$2 $175, $0 Do Not Advertise $150, $15 $100, $0 In their quest to maximize combined total profits, Mark and George's Pizzas find themselves at a critical juncture. As they carefully evaluate the potential outcomes and weigh their strategic options, the future of Moncton's pizza industry hangs in the balance. Let's imagine both players are analyzing the payoff matrix seeking the optimal combination of actions that will yield the highest collective profit. What actions maximize their combined total profits? a. Mark's Pizza to "Advertise" and George's Pizza to "Stay Out". b. Mark's Pizza to "Do Not Advertise" and George's Pizza to "Stay Out" C. Mark's Pizza to Do Not Advertise" and George's Pizza to "Enter" d. Mark's Pizza to "Advertise" and George's Pizza to "Enter"arrow_forwardWith your team I would like you to complete the following questions after please post your replies and we will discuss in class Choose a financial instrument or market (such as stocks, bonds, insurance, cash, gold, bitcoin). Explain how investments work for the individual investor mainly yourself. With the current market upheaval and uncertainty what would you and your team consider the best options for investment. Consider the idea of short term investing vs long term investing, laddering, safe haven, liquidity, and risk) Consider Roth IRA vs traditional IRA, ETF's, CD's, Mutual Funds. Always consider taxes and inflation your return should always be greater then inflation and taxes.arrow_forwardShort Description Fiscal Policy Graph Details Shown is a Fiscal Policy diagram with the variable Real GDP (billions of dollars) on the x-axis and the variable Price Level on the y-axis. The x-axis is scaled from 0 to 800 billion dollars with an increment of 40 billion dollars, and the y-axis is scaled from 30 to 150 units with an increment of 5 units. Object Details On the graph we have:Four Line Objects:An upward sloping Aggregate Supply, AS line with two endpoints:Point 1 at (160, 70)Point 2 at (720, 140)A downward sloping Aggregate Demand, AD1 line with two endpoints:Point 1 at (80, 110)Point 2 at (640, 40)A vertical Long-run Aggregate Supply, LRAS with two endpoints:Point 1 at (400, 145)Point 2 at (400, 30)A downward sloping Aggregate Demand, AD line with two endpoints:Point 1 at (720, 60)Point 2 at (160, 130)Two Reference Points:Lines AS, AD, and LRAS intersect at (400, 100)Lines AS and AD1 intersect at (280, 85) a. How much does aggregate demand need to change to restore the…arrow_forward
- Fiscal Policy Graph Details Shown is a Fiscal Policy diagram with the variable Real GDP (billions of dollars) on the x-axis and the variable Price Level on the y-axis. The x-axis is scaled from 0 to 1000 billion dollars with an increment of 50 billion dollars, and the y-axis is scaled from 0 to 180 units with an increment of 10 units. Object Details On the graph we have:Four Line Objects:An upward sloping Aggregate Supply, AS line with two endpoints:Point 1 at (200, 40)Point 2 at (800, 160)A downward sloping Aggregate Demand, AD line with two endpoints:Point 1 at (200, 160)Point 2 at (800, 40)A downward sloping Aggregate Demand, AD1 line with two endpoints:Point 1 at (350, 170)Point 2 at (900, 60)A vertical Long-run Aggregate Supply, LRAS line with two endpoints:Point 1 at (500, 170)Point 2 at (500, 0)Two Reference Points:Lines AS and AD1 intersect at (600, 120)Lines AS, AD, and LRAS intersect at (500, 100) a. How much does aggregate demand need to change to restore the…arrow_forwarda. How much does aggregate demand need to change to restore the economy to its long-run equilibrium? $ billion b. If the MPC is 0.6, how much does government purchases need to change to shift aggregate demand by the amount you found in part a? $ billion Suppose instead that the MPC is 0.95. c. How much does aggregate demand and government purchases need to change to restore the economy to its long-run equilibrium? Aggregate demand needs to change by $ billion and government purchases need to change by $ billion.arrow_forwardPrice P 1. Explain the distinction between outputs and outcomes in social service delivery 2. Discuss the Rawlsian theory of justice and briefly comment on its relevance to the political economy of South Africa. [2] [7] 3. Redistributive expenditure can take the form of direct cash transfers (grants) and/or in- kind subsidies. With references to the graphs below, discuss the merits of these two transfer types in the presence and absence of a positive externality. [6] 9 Quantity (a) P, MC, MB MSB MPB+MEB MPB P-MC MEB Quantity (6) MCarrow_forward
- Don't use ai to answer I will report you answerarrow_forwardIf 17 Ps are needed and no on-hand inventory exists fot any of thr items, how many Cs will be needed?arrow_forwardExercise 5Consider the demand and supply functions for the notebooks market.QD=10,000−100pQS=900pa. Make a table with the corresponding supply and demand schedule.b. Draw the corresponding graph.c. Is it possible to find the price and quantity of equilibrium with the graph method? d. Find the price and quantity of equilibrium by solving the system of equations.arrow_forward
 Brief Principles of Macroeconomics (MindTap Cours...EconomicsISBN:9781337091985Author:N. Gregory MankiwPublisher:Cengage Learning
 Principles of MicroeconomicsEconomicsISBN:9781305156050Author:N. Gregory MankiwPublisher:Cengage Learning
 Essentials of Economics (MindTap Course List)EconomicsISBN:9781337091992Author:N. Gregory MankiwPublisher:Cengage Learning
 Principles of Economics (MindTap Course List)EconomicsISBN:9781305585126Author:N. Gregory MankiwPublisher:Cengage Learning
 Principles of Microeconomics (MindTap Course List)EconomicsISBN:9781305971493Author:N. Gregory MankiwPublisher:Cengage Learning