Concept explainers
(a)
Interpretation:
Current follower that will produce a 1.0 V output for 10.0 µA input current should be designed.
Concept introduction:
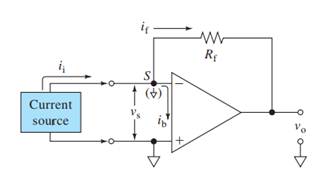
Operational amplifiers can be used to measure or process currents by connecting them in the current follower mode. This mode provides a nearly zero resistance load to the current source and prevents it from being loaded by a measuring device or circuit.

Here,
V+, V- = input voltages
Vs = Input difference voltage
V0 = output voltage
ib = input bias current
if = feedback current
ii = input current
Rf = feedback resistor
Also,
(b)
Interpretation:
Effective input resistance of the current follower designed in part (a) should be calculated.
Concept introduction:

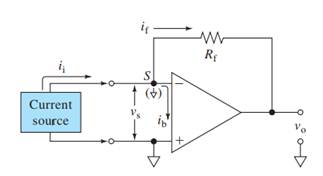
Here,
V+, V- = input voltages
Vs = Input difference voltage
V0 = output voltage
ib = input bias current
if = feedback current
ii = input current
Rf = feedback resistor
Ri = effective input resistance
A = open loop gain
Also,
(c)
Interpretation:
The percent relative error for the circuit designed in part (a) for an input current of 25 µA should be calculated.
Concept introduction:

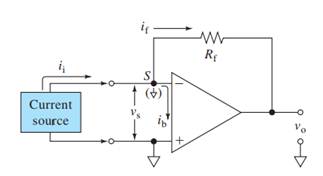
Here,
V+, V- = input voltages
Vs = Input difference voltage
V0 = output voltage
ib = input bias current
if = feedback current
ii = input current
Rf = feedback resistor
Ri = effective input resistance
A = open loop gain
Here,
Also,
Thus,
Relative error percentage =
Want to see the full answer?
Check out a sample textbook solution
Chapter 3 Solutions
INSTRUMENTAL ANALYSIS-ACCESS >CUSTOM<
- What would be the best choices for the missing reagents 1 and 3 in this synthesis? 1 1. PPh3 2. n-BuLi 2 • Draw the missing reagents in the drawing area below. You can draw them in any arrangement you like. • Do not draw the missing reagent 2. If you draw 1 correctly, we'll know what it is. • Note: if one of your reagents needs to contain a halogen, use bromine. Click and drag to start drawing a structure.arrow_forwardThe product on the right-hand side of this reaction can be prepared from two organic reactants, under the conditions shown above and below the arrow. Draw 1 and 2 below, in any arrangement you like. 1+2 NaBH₂CN H+ N Click and drag to start drawing a structure. X $arrow_forwardExplain what is the maximum absorbance of in which caffeine absorbs?arrow_forward
- Explain reasons as to why the amount of caffeine extracted from both a singular extraction (5ml Mountain Dew) and a multiple extraction (2 x 5.0ml Mountain Dew) were severely high when compared to coca-cola?arrow_forwardProtecting Groups and Carbonyls 6) The synthesis generates allethrolone that exhibits high insect toxicity but low mammalian toxicity. They are used in pet shampoo, human lice shampoo, and industrial sprays for insects and mosquitos. Propose detailed mechanistic steps to generate the allethrolone label the different types of reagents (Grignard, acid/base protonation, acid/base deprotonation, reduction, oxidation, witting, aldol condensation, Robinson annulation, etc.) III + VI HS HS H+ CH,CH,Li III I II IV CI + P(Ph)3 V ༼ Hint: no strong base added VI S VII IX HO VIII -MgBr HgCl2,HgO HO. isomerization aqeuous solution H,SO, ༽༽༤༽༽ X MeOH Hint: enhances selectivity for reaction at the S X ☑arrow_forwardDraw the complete mechanism for the acid-catalyzed hydration of this alkene. esc 田 Explanation Check 1 888 Q A slock Add/Remove step Q F4 F5 F6 A བྲA F7 $ % 5 @ 4 2 3 & 6 87 Click and drag to start drawing a structure. © 2025 McGraw Hill LLC. All Rights Reserved. Terms of Use | Privacy Ce W E R T Y U S D LL G H IK DD 요 F8 F9 F10 F1 * ( 8 9 0 O P J K L Z X C V B N M H He commandarrow_forward
- Explanation Check F1 H₂O H₂ Pd 1) MCPBA 2) H3O+ 1) Hg(OAc)2, H₂O 2) NaBH4 OH CI OH OH OH hydration halohydrin formation addition halogenation hydrogenation inhalation hydrogenation hydration ☐ halohydrin formation addition halogenation formation chelation hydrogenation halohydrin formation substitution hydration halogenation addition Ohalohydrin formation subtraction halogenation addition hydrogenation hydration F2 80 F3 σ F4 F5 F6 1 ! 2 # 3 $ 4 % 05 Q W & Å © 2025 McGraw Hill LLC. All Rights Reserved. F7 F8 ( 6 7 8 9 LU E R T Y U A F9arrow_forwardShow the mechanism steps to obtain the lowerenergy intermediate: *see imagearrow_forwardSoap is made by the previous reaction *see image. The main difference between one soap and another soap isthe length (number of carbons) of the carboxylic acid. However, if a soap irritates your skin, they mostlikely used too much lye.Detergents have the same chemical structure as soaps except for the functional group. Detergentshave sulfate (R-SO4H) and phosphate (R-PO4H2) functional groups. Draw the above carboxylic acidcarbon chain but as the two variants of detergents. *see imagearrow_forward
 Principles of Instrumental AnalysisChemistryISBN:9781305577213Author:Douglas A. Skoog, F. James Holler, Stanley R. CrouchPublisher:Cengage Learning

