
Videos
Case Problem 3 Business Schools of Asia-Pacific
The pursuit of a higher education degree in business is now international. A survey shows that more and more Asians choose the master of business administration (MBA) degree route to corporate success. As a result, the number of applicants for MBA courses at Asia-Pacific schools continues to increase.
Across the region, thousands of Asians show an increasing willingness to temporarily shelve their and two years in pursuit of a theoretical business qualification. Courses in these schools are notoriously tough and include economics, banking, marketing, behavioral sciences, labor relations, decision making, strategic thinking, business law, and more. The data in Table 3.11 shows some of characteristics of the leading Asia-Pacific business schools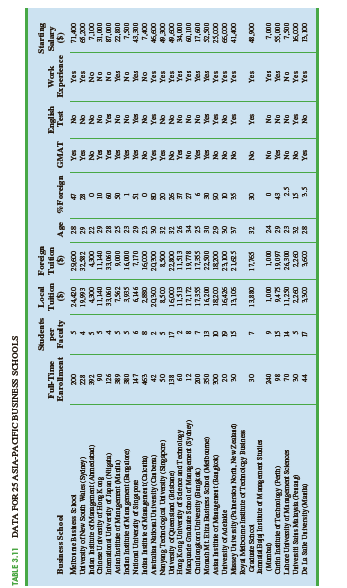
Managerial Report
Use the methods of
a. Any difference between local and foreign tuition costs.
b.Any difference between mean starting salaries for schools requiring and not requiring work experience.
c. Any difference between starting salaries for schools requiring and not requiring English tests.
Want to see the full answer?
Check out a sample textbook solution
Chapter 3 Solutions
Essentials of Modern Business Statistics with Microsoft Office Excel (Book Only)


- Question: we know that for rt. (x+ys s ا. 13. rs. and my so using this, show that it vye and EIXI, EIYO This : E (IX + Y) ≤2" (EIX (" + Ely!")arrow_forwardTheorem 2.4 (The Hölder inequality) Let p+q=1. If E|X|P < ∞ and E|Y| < ∞, then . |EXY ≤ E|XY|||X|| ||||qarrow_forwardTheorem 7.6 (Etemadi's inequality) Let X1, X2, X, be independent random variables. Then, for all x > 0, P(max |S|>3x) ≤3 max P(S| > x). Isk≤narrow_forward
- Theorem 7.2 Suppose that E X = 0 for all k, that Var X = 0} x) ≤ 2P(S>x 1≤k≤n S√2), -S√2). P(max Sk>x) ≤ 2P(|S|>x- 1arrow_forwardThree players (one divider and two choosers) are going to divide a cake fairly using the lone divider method. The divider cuts the cake into three slices (s1, s2, and s3).If the chooser's declarations are Chooser 1: {s3} and Chooser 2: {s3}, which of the following is a fair division of the cake?arrow_forwardTheorem 1.4 (Chebyshev's inequality) (i) Suppose that Var X x)≤- x > 0. 2 (ii) If X1, X2,..., X, are independent with mean 0 and finite variances, then Στη Var Xe P(|Sn| > x)≤ x > 0. (iii) If, in addition, X1, X2, Xn are identically distributed, then nVar Xi P(|Sn> x) ≤ x > 0. x²arrow_forwardTheorem 2.5 (The Lyapounov inequality) For 0arrow_forwardTheorem 1.6 (The Kolmogorov inequality) Let X1, X2, Xn be independent random variables with mean 0 and suppose that Var Xk 0, P(max Sk>x) ≤ Isk≤n Σ-Var X In particular, if X1, X2,..., X, are identically distributed, then P(max Sx) ≤ Isk≤n nVar X₁ x2arrow_forwardTheorem 3.1 (The Cauchy-Schwarz inequality) Suppose that X and Y have finite variances. Then |EXYarrow_forwardAbout 25% of people in America use a certain social media website. In a group with 20 people (assume that it is a random sample of people in America), what are the following probabilities? (Round your answers to three decimal places.) a) At least one of them uses the website. b) More than two of them use the website. c) None of them use the website. d) At least 18 of them do not use the website. please show all steps and work for probabilities. answer parts a-d.arrow_forwardExample 4 (Part 2) We can use Statkey to take 50 different random samples of size 20 each, find the mean of each sample, and compute a confidence interval for each one. The graph of the sampling distribution of the means is on the left below, and that of the 50 confidence intervals is on the right. 1. What does each dot on the left hand dotplot represent? StatKey Sampling Distribution for a Mean Percent with Internet Access (Countries) ▾ Show Data Table Edit Data Choose samples of size n = 20 Upload File Change Column(s) Generate 1 Sample Generate 10 Samples Generate 100 Samples Generate 1000 Samples Reset Plot Sampling Dotplot of Mean Left Tail Two-Tail Right Tail 60 50 40 40 30 20 20 10 samples = 50 mean = 41.626 std. error = 5.089 : .: : :: 0 25 30 35 40 45 50 55 60 41.626 Data Plots Confidence Intervals 95%-> Confidence Intervals Coverage 48/50 = 96% 20 40 60 80 2. Circle the confidence intervals that failed to capture the true mean. 3. Circle the sample means that produced those…arrow_forwardExample 4 (Part 1) One of the datasets in the Lock book contains information about 215 countries of the world. One of the variables is the percentage of people in the country who have access to the internet. We have data for 203 of those countries. The plot on the right shows a dotplot of the data. 1. What are the cases? Population n = 203, mean = 43.024 median = 43.5, stdev = 29.259 20 2. What does each dot on the dotplot represent? 15 10 5 20 40 43.024 60 80 3. What type of data is do we collect from the cases, quantitative or categorical?arrow_forwardarrow_back_iosSEE MORE QUESTIONSarrow_forward_iosRecommended textbooks for you
 Solve ANY Optimization Problem in 5 Steps w/ Examples. What are they and How do you solve them?; Author: Ace Tutors;https://www.youtube.com/watch?v=BfOSKc_sncg;License: Standard YouTube License, CC-BYTypes of solution in LPP|Basic|Multiple solution|Unbounded|Infeasible|GTU|Special case of LP problem; Author: Mechanical Engineering Management;https://www.youtube.com/watch?v=F-D2WICq8Sk;License: Standard YouTube License, CC-BYOptimization Problems in Calculus; Author: Professor Dave Explains;https://www.youtube.com/watch?v=q1U6AmIa_uQ;License: Standard YouTube License, CC-BYIntroduction to Optimization; Author: Math with Dr. Claire;https://www.youtube.com/watch?v=YLzgYm2tN8E;License: Standard YouTube License, CC-BY