
Concept explainers
a
To prove:
Graphical representation of utility function whether IC curve is convex or not.
a
Explanation of Solution
The utility function is linear. This means that the goods x and y are perfect substitutes. For simplicity, the value of utility is taken to be constant at 60. Then the equation for the indifference curve becomes:
To graph the indifference curve:
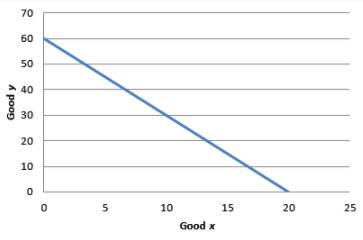
Graph 1
The MRS is constant at 3. Hence, the IC curve is not convex.
Introduction:
Rate of substitution is the ratio of two goods at which consumer gives away a quantity of good 1 in order to get good 2
b)
To prove:
Graphical representation of utility function whether IC curve is convex or not.
b)
Explanation of Solution
Let utility function be set equal to 10.
Then the equation will be:
The IC for utility equal to 10 can be obtained by graphing the following equation:
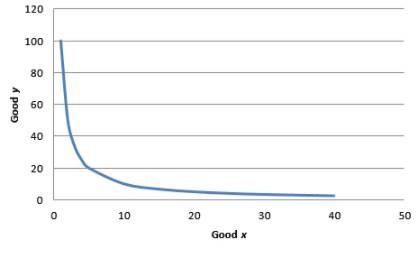
Graph 2
For equation,
As x is in the denominator, the MRS decreases when x increases. Hence indifference curve is convex.
Introduction:
Rate of substitution is the ratio of two goods at which consumer gives away a quantity of good 1 in order to get good 2
c)
To prove:
Graphical representation of utility function whether IC curve is convex or not.
c)
Explanation of Solution
To simplify the function, arbitrarily set the utility at 8. So, the utility function becomes
Graphical representation:
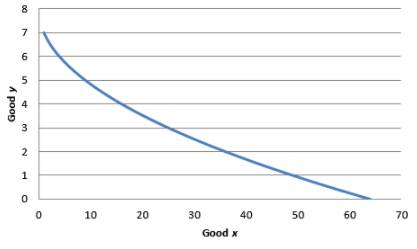
Graph 3
As x is in the denominator, the MRS decreases when x increases. Hence indifference curve is convex.
Introduction:
Rate of substitution is the ratio of two goods at which consumer gives away a quantity of good 1 in order to get good 2
d)
To prove:
Graphical representation of utility function whether IC curve is convex or not.
d)
Explanation of Solution
Utility is set equal to 4. Then the equation for equation is:
The indifference curve for utility equal to 4:
The graph is shown below:
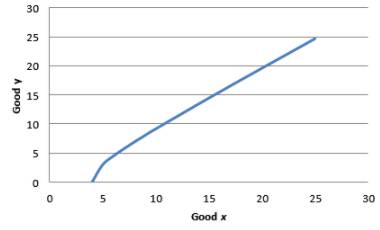
Graph 4
In the above equation, x is numerator. Though there is a negative sign in front of the fraction. This means that as x increases, the marginal rate of substitution increases.
Hence, the indifference curves are not convex.
Introduction:
Rate of substitution is the ratio of two goods at which consumer gives away a quantity of good 1 in order to get good 2
e)
To prove:
Graphical representation of utility function whether IC curve is convex or not.
e)
Explanation of Solution
To simplify the problem, we arbitrarily take utility equal to 1.
To graph the indifference curve,
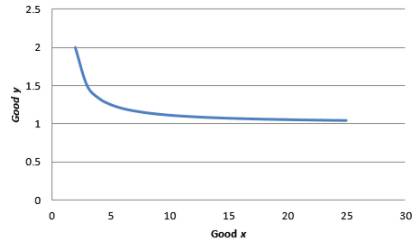
Graph 5
MRS =
In the above equation, x is in numerator. Hence, as x increases the marginal rate of substitution decreases. Hence, the indifference curves are convex.
Introduction:
Rate of substitution is the ratio of two goods at which consumer gives away a quantity of good 1 in order to get good 2
Want to see more full solutions like this?
Chapter 3 Solutions
EBK MICROECONOMIC THEORY: BASIC PRINCIP
- This Wendy’s commercial confuses the notions of appreciation and consumer surplus. Recall that consumer surplus is the difference between what a consumer is willing to pay for a good and what they actually pay for it. According to standard economic theory, consumer surplus must always bearrow_forwardIn economics, the cost of producing a good: Question 6 options: is the maximum value of other goods that could have been produced using the same resources. equals the out-of-pocket costs incurred in producing the good. is the value of inputs used up in production. is the value of other goods that could have been produced using the same resources.arrow_forwardPlease correct answer and don't used hand raiting and don't used Ai solutionarrow_forward
- not use ai pleasearrow_forwardGates Doubles Down on Malaria Eradication The End Malaria Council, convened by Bill Gates and Ray Chambers, seeks to mobilize resources to prevent and treat malaria. The current level of financing is too low to end malaria. Bruno Moonen, deputy director for malaria at the Gates Foundation, says that more resources, more leadership, and new technologies are needed to eradicate malaria in the current generation. Is Bruno Moonen talking about production efficiency or allocative efficiency or both? Bruno Moonen is talking about _______. A. production efficiency but not allocative efficiency B. production efficiency and allocative efficiency C. allocative efficiency but not production efficiency D. neither production efficiency nor allocative efficiencyarrow_forwardWhat challenges do medical facilities face when trying to become more culturally competent? What kinds of assumptions do providers sometimes make about people from other cultures? What factors may cause providers to relate to patients in a biased manner? What can healthcare organizations do to ensure cultural competence among their employees?arrow_forward
- Brazil, Russia, India, China, and South Africa, also known as BRICS, are emerging countries poised to be dominant economic players in the 21st century. What are some of the political, legal and economic conditions that help or hinder economic expansion for these countries?arrow_forwardExplain what is Microeconomics? Why is it important for all of us to understand what are the drivers in microeconomics?arrow_forwardThe production function for a product is given by Q =100KL.if the price of capital is 120 dollars per day and the price of labor 30 dollars per day what is the minimum cost of producing 1000 units of output ?arrow_forward
- خصائص TVAarrow_forwardplease show complete solution, step by step, thanksarrow_forwardTo determine the benefits of extending hours of operation for a food truck business, the couple should calculate additional revenue, break-even analysis, market demand, and raise prices. They should analyze competitors' prices and customer sensitivity to price changes, determine price elasticity, and test the strategy by implementing a slight price increase and monitoring sales closely. If costs exceed revenues, the couple should analyze their financials, evaluate their business model, explore new revenue streams, and consider long-term viability. They should analyze their financial statements to identify high costs and areas for reduction, evaluate their business model based on market demand, and explore new revenue streams like catering, special events, or partnerships with local businesses. Long-term viability is a key consideration, as if the business still operates at a loss after making adjustments, it may be necessary to consider shutting down. Staying in business should be…arrow_forward
 Economics (MindTap Course List)EconomicsISBN:9781337617383Author:Roger A. ArnoldPublisher:Cengage Learning
 Microeconomics: Principles & PolicyEconomicsISBN:9781337794992Author:William J. Baumol, Alan S. Blinder, John L. SolowPublisher:Cengage Learning


