
EBK BUSINESS ANALYTICS
3rd Edition
ISBN: 9780136880844
Author: Evans
Publisher: PEARSON
expand_more
expand_more
format_list_bulleted
Question
Chapter 3, Problem 2PE
To determine
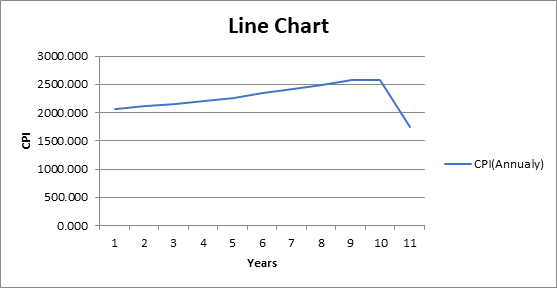
To create a line chart showing the growth in the annual CPI.
Expert Solution & Answer
Explanation of Solution
Given:
The Consumer price index excel file data is as follows:
| Consumer Price Index - All Urban Consumers | Bureau of Labor Statistics | |||||||||||
| Year | Jan | Feb | Mar | Apr | May | Jun | Jul | Aug | Sep | Oct | Nov | Dec |
| 2000 | 169.300 | 170.000 | 171.000 | 170.900 | 171.200 | 172.200 | 172.700 | 172.700 | 173.600 | 173.900 | 174.200 | 174.600 |
| 2001 | 175.600 | 176.000 | 176.100 | 176.400 | 177.300 | 177.700 | 177.400 | 177.400 | 178.100 | 177.600 | 177.500 | 177.400 |
| 2002 | 177.700 | 178.000 | 178.500 | 179.300 | 179.500 | 179.600 | 180.000 | 180.500 | 180.800 | 181.200 | 181.500 | 181.800 |
| 2003 | 182.600 | 183.600 | 183.900 | 183.200 | 182.900 | 183.100 | 183.700 | 184.500 | 185.100 | 184.900 | 185.000 | 185.500 |
| 2004 | 186.300 | 186.700 | 187.100 | 187.400 | 188.200 | 188.900 | 189.100 | 189.200 | 189.800 | 190.800 | 191.700 | 191.700 |
| 2005 | 191.600 | 192.400 | 193.100 | 193.700 | 193.600 | 193.700 | 194.900 | 196.1000 | 198.800 | 199.100 | 198.100 | 198.100 |
| 2006 | 199.200 | 199.400 | 199.700 | 200.600 | 201.400 | 201.900 | 202.900 | 203.700 | 202.900 | 201.800 | 202.000 | 203.100 |
| 2007 | 203.372 | 204.258 | 205.312 | 205.959 | 206.850 | 207.202 | 207.651 | 207.671 | 208.503 | 209.073 | 210.740 | 211.434 |
| 2008 | 212.225 | 212.703 | 213.543 | 214.106 | 215.287 | 217.279 | 219.102 | 218.779 | 218.846 | 216.832 | 212.923 | 211.339 |
| 2009 | 211.959 | 212.877 | 212.643 | 212.810 | 213.050 | 214.558 | 214.774 | 215.566 | 215.911 | 216.357 | 216.859 | 217.224 |
| 2010 | 217.587 | 217.591 | 217.729 | 217.579 | 217.224 | 216.929 | 217.597 | 218.150 | ||||
Calculation:
Since, we have to show the line chart for the growth in annual CPI. Thus, we have to take the sum of the months yearly basis. We will use the formula for sum, such as,
=SUM(number1,[number2],...])
Thus the result will be as:
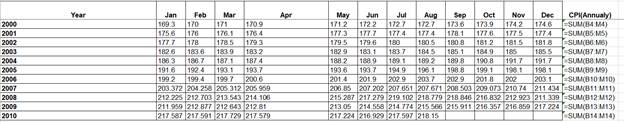
And the outcome will be:
| Year | Jan | Feb | Mar | Apr | May | Jun | Jul | Aug | Sep | Oct | Nov | Dec | CPI(Annualy) |
| 2000 | 169.300 | 170.000 | 171.000 | 170.900 | 171.200 | 172.200 | 172.700 | 172.700 | 173.600 | 173.900 | 174.200 | 174.600 | 2066.300 |
| 2001 | 175.600 | 176.000 | 176.100 | 176.400 | 177.300 | 177.700 | 177.400 | 177.400 | 178.100 | 177.600 | 177.500 | 177.400 | 2124.500 |
| 2002 | 177.700 | 178.000 | 178.500 | 179.300 | 179.500 | 179.600 | 180.000 | 180.500 | 180.800 | 181.200 | 181.500 | 181.800 | 2158.400 |
| 2003 | 182.600 | 183.600 | 183.900 | 183.200 | 182.900 | 183.100 | 183.700 | 184.500 | 185.100 | 184.900 | 185.000 | 185.500 | 2208.000 |
| 2004 | 186.300 | 186.700 | 187.100 | 187.400 | 188.200 | 188.900 | 189.100 | 189.200 | 189.800 | 190.800 | 191.700 | 191.700 | 2266.900 |
| 2005 | 191.600 | 192.400 | 193.100 | 193.700 | 193.600 | 193.700 | 194.900 | 196.1000 | 198.800 | 199.100 | 198.100 | 198.100 | 2343.200 |
| 2006 | 199.200 | 199.400 | 199.700 | 200.600 | 201.400 | 201.900 | 202.900 | 203.700 | 202.900 | 201.800 | 202.000 | 203.100 | 2418.600 |
| 2007 | 203.372 | 204.258 | 205.312 | 205.959 | 206.850 | 207.202 | 207.651 | 207.671 | 208.503 | 209.073 | 210.740 | 211.434 | 2488.025 |
| 2008 | 212.225 | 212.703 | 213.543 | 214.106 | 215.287 | 217.279 | 219.102 | 218.779 | 218.846 | 216.832 | 212.923 | 211.339 | 2582.964 |
| 2009 | 211.959 | 212.877 | 212.643 | 212.810 | 213.050 | 214.558 | 214.774 | 215.566 | 215.911 | 216.357 | 216.859 | 217.224 | 2574.588 |
| 2010 | 217.587 | 217.591 | 217.729 | 217.579 | 217.224 | 216.929 | 217.597 | 218.150 | 1740.386 |
Then, we will construct the line chart by selecting the last column of CPI (annually) of the sums of the months year wise and then go to the insert button and then click on the line chart and the line chart is created,
The line chart is as follows:
Want to see more full solutions like this?
Subscribe now to access step-by-step solutions to millions of textbook problems written by subject matter experts!
Students have asked these similar questions
If the average price of a new one family home is $246,300 with a standard deviation of $15,000 find the minimum and maximum prices of the houses that a contractor will build to satisfy 88% of the market value
21. ANALYSIS OF LAST DIGITS Heights of statistics students were obtained by the author as
part of an experiment conducted for class. The last digits of those heights are listed below.
Construct a frequency distribution with 10 classes. Based on the distribution, do the
heights appear to be reported or actually measured? Does there appear to be a gap in the
frequencies and, if so, how might that gap be explained? What do you know about the
accuracy of the results?
3 4
555
0 0 0 0 0 0 0 0 0 1 1 23 3
5 5 5 5 5 5 5 5 5 5 5 5 6 6 8 8 8 9
A side view of a recycling bin lid is diagramed below where two panels come together at a right angle.
45 in
24 in
Width? —
Given this information, how wide is the recycling bin in inches?
Chapter 3 Solutions
EBK BUSINESS ANALYTICS
Ch. 3 - Prob. 2PECh. 3 - Create a line chart for the closing prices for all...Ch. 3 - Create a pie chart showing the breakdown of...Ch. 3 - Create a stacked area chart contrasting primary...Ch. 3 - A national homebuilder builds single-family homes...Ch. 3 - The Excel file Facebook Survey provides data...Ch. 3 - Create a bubble chart for the first five colleges...Ch. 3 - Construct a column chart for the data in the Excel...Ch. 3 - The Excel file Internet Usage provides data about...Ch. 3 - Construct an appropriate chart to show the...
Ch. 3 - A marketing researcher surveyed 92 individuals,...Ch. 3 - In the Excel file Banking Data, apply the...Ch. 3 - Apply three different colors of data bars to...Ch. 3 - For the Store and Regional Sales database, apply a...Ch. 3 - For the Excel file Closing Stock Prices, apply...Ch. 3 - Create a useful dashboard for the data in the...Ch. 3 - Create a useful dashboard for the data in the...Ch. 3 - Create a useful dashboard for the data in the...
Knowledge Booster

Similar questions
- 1 No. 2 3 4 Binomial Prob. X n P Answer 5 6 4 7 8 9 10 12345678 8 3 4 2 2552 10 0.7 0.233 0.3 0.132 7 0.6 0.290 20 0.02 0.053 150 1000 0.15 0.035 8 7 10 0.7 0.383 11 9 3 5 0.3 0.132 12 10 4 7 0.6 0.290 13 Poisson Probability 14 X lambda Answer 18 4 19 20 21 22 23 9 15 16 17 3 1234567829 3 2 0.180 2 1.5 0.251 12 10 0.095 5 3 0.101 7 4 0.060 3 2 0.180 2 1.5 0.251 24 10 12 10 0.095arrow_forwardstep by step on Microssoft on how to put this in excel and the answers please Find binomial probability if: x = 8, n = 10, p = 0.7 x= 3, n=5, p = 0.3 x = 4, n=7, p = 0.6 Quality Control: A factory produces light bulbs with a 2% defect rate. If a random sample of 20 bulbs is tested, what is the probability that exactly 2 bulbs are defective? (hint: p=2% or 0.02; x =2, n=20; use the same logic for the following problems) Marketing Campaign: A marketing company sends out 1,000 promotional emails. The probability of any email being opened is 0.15. What is the probability that exactly 150 emails will be opened? (hint: total emails or n=1000, x =150) Customer Satisfaction: A survey shows that 70% of customers are satisfied with a new product. Out of 10 randomly selected customers, what is the probability that at least 8 are satisfied? (hint: One of the keyword in this question is “at least 8”, it is not “exactly 8”, the correct formula for this should be = 1- (binom.dist(7, 10, 0.7,…arrow_forwardKate, Luke, Mary and Nancy are sharing a cake. The cake had previously been divided into four slices (s1, s2, s3 and s4). What is an example of fair division of the cake S1 S2 S3 S4 Kate $4.00 $6.00 $6.00 $4.00 Luke $5.30 $5.00 $5.25 $5.45 Mary $4.25 $4.50 $3.50 $3.75 Nancy $6.00 $4.00 $4.00 $6.00arrow_forward
- Faye cuts the sandwich in two fair shares to her. What is the first half s1arrow_forwardQuestion 2. An American option on a stock has payoff given by F = f(St) when it is exercised at time t. We know that the function f is convex. A person claims that because of convexity, it is optimal to exercise at expiration T. Do you agree with them?arrow_forwardQuestion 4. We consider a CRR model with So == 5 and up and down factors u = 1.03 and d = 0.96. We consider the interest rate r = 4% (over one period). Is this a suitable CRR model? (Explain your answer.)arrow_forward
- Question 3. We want to price a put option with strike price K and expiration T. Two financial advisors estimate the parameters with two different statistical methods: they obtain the same return rate μ, the same volatility σ, but the first advisor has interest r₁ and the second advisor has interest rate r2 (r1>r2). They both use a CRR model with the same number of periods to price the option. Which advisor will get the larger price? (Explain your answer.)arrow_forwardQuestion 5. We consider a put option with strike price K and expiration T. This option is priced using a 1-period CRR model. We consider r > 0, and σ > 0 very large. What is the approximate price of the option? In other words, what is the limit of the price of the option as σ∞. (Briefly justify your answer.)arrow_forwardQuestion 6. You collect daily data for the stock of a company Z over the past 4 months (i.e. 80 days) and calculate the log-returns (yk)/(-1. You want to build a CRR model for the evolution of the stock. The expected value and standard deviation of the log-returns are y = 0.06 and Sy 0.1. The money market interest rate is r = 0.04. Determine the risk-neutral probability of the model.arrow_forward
- Several markets (Japan, Switzerland) introduced negative interest rates on their money market. In this problem, we will consider an annual interest rate r < 0. We consider a stock modeled by an N-period CRR model where each period is 1 year (At = 1) and the up and down factors are u and d. (a) We consider an American put option with strike price K and expiration T. Prove that if <0, the optimal strategy is to wait until expiration T to exercise.arrow_forwardWe consider an N-period CRR model where each period is 1 year (At = 1), the up factor is u = 0.1, the down factor is d = e−0.3 and r = 0. We remind you that in the CRR model, the stock price at time tn is modeled (under P) by Sta = So exp (μtn + σ√AtZn), where (Zn) is a simple symmetric random walk. (a) Find the parameters μ and σ for the CRR model described above. (b) Find P Ste So 55/50 € > 1). StN (c) Find lim P 804-N (d) Determine q. (You can use e- 1 x.) Ste (e) Find Q So (f) Find lim Q 004-N StN Soarrow_forwardIn this problem, we consider a 3-period stock market model with evolution given in Fig. 1 below. Each period corresponds to one year. The interest rate is r = 0%. 16 22 28 12 16 12 8 4 2 time Figure 1: Stock evolution for Problem 1. (a) A colleague notices that in the model above, a movement up-down leads to the same value as a movement down-up. He concludes that the model is a CRR model. Is your colleague correct? (Explain your answer.) (b) We consider a European put with strike price K = 10 and expiration T = 3 years. Find the price of this option at time 0. Provide the replicating portfolio for the first period. (c) In addition to the call above, we also consider a European call with strike price K = 10 and expiration T = 3 years. Which one has the highest price? (It is not necessary to provide the price of the call.) (d) We now assume a yearly interest rate r = 25%. We consider a Bermudan put option with strike price K = 10. It works like a standard put, but you can exercise it…arrow_forward
arrow_back_ios
SEE MORE QUESTIONS
arrow_forward_ios
Recommended textbooks for you

 Glencoe Algebra 1, Student Edition, 9780079039897...AlgebraISBN:9780079039897Author:CarterPublisher:McGraw Hill
Glencoe Algebra 1, Student Edition, 9780079039897...
Algebra
ISBN:9780079039897
Author:Carter
Publisher:McGraw Hill