Subpart (a):
Calculate the member of required labor.
Subpart (a):
Explanation of Solution
Number of workers required to produce one unit of goods can be calculated using the following formula.
Substitute the respective values in Equation (1) to calculate the required number of person to produce one unit of car in U.S.
Required labor to produce one unit of car in U.S. is 0.25.
Table 1 illustrates the workers required to produce a car and a ton of grain in the U.S. and the Japan that obtained by using Equation (1).
Table 1
| Workers required to produce | ||
| One Car | One Ton of Grain | |
| U.S. | 0.25 workers | 0.10 workers |
| Japan | 0.25 workers | 0.20 workers |
Concept introduction:
Subpart (b):
Draw the production possibility frontier.
Subpart (b):
Explanation of Solution
Figure 1 shows the productive capacity of two countries.
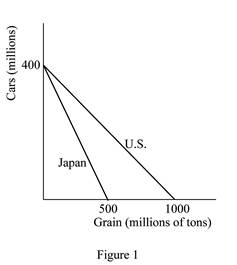
In Figure 1, the horizontal axis measures the quantity of grains produced by both the countries and the vertical axis measures the quantity of cars produced. If either economy, that is, the U.S. or Japan devotes all of its 100 million workers in producing cars each economy can produce 400 million cars in a year
Concept introduction:
Production Possibility Frontier (PPF): PPF refers to the maximum possible combinations of output of goods or services that an economy can attain by efficiently utilizing and employing full resources.
Subpart (c):
Calculate the opportunity cost.
Subpart (c):
Explanation of Solution
Opportunity cost of a car for the U.S. is calculated as follows.
Thus, the opportunity cost of a car for the U.S. is 2.5 tons of grains.
Opportunity cost of a car for Japan is calculated as follows.
Thus, the opportunity cost of a car for Japan is 1.25 tons of grains.
Opportunity cost of producing a ton of grains in the U.S. is calculated as follows
Thus, the opportunity cost of producing a ton of grains in the U.S. is 0.4 units of cars.
Opportunity cost of producing a ton of grains in Japan is calculated as follows.
Thus, the opportunity cost of producing a ton of grains in Japan is 0.8 units of cars.
The results can be tabulated in Table 2 below.
Table 2
| Opportunity Cost | ||
| One Car | One Ton of Grain | |
| U.S. | 2.5 tons of grains | 0.4 units of car |
| Japan | 1.25 tons of grains | 0.8 units of car |
Concept introduction:
Opportunity cost: Opportunity cost is the cost of a foregone alternative, that is, the loss of other alternative when one alternative is chosen.
Subpart (d):
Find the country that has
Subpart (d):
Explanation of Solution
Neither of these countries has an absolute advantage in producing cars. This is because they are equally productive in the production of a car (4 cars per worker per year). However, in the production of grains, the United States has an absolute advantage because it is more productive than Japan. The U.S. can produce 10 tons of grains per worker per year; whereas Japan can produce only 5 tons of grains per worker per year.
Concept introduction:
Absolute advantage: It is the ability to produce a good using fewer inputs than another producer.
Subpart (e):
Find the country that has absolute advantage in the production of goods.
Subpart (e):
Explanation of Solution
Japan has a
Concept introduction:
Comparative advantage: It refers to the ability to produce a good at a lower opportunity cost than another producer.
Subpart (f):
Calculate the total production before the trade.
Subpart (f):
Explanation of Solution
Without trade and with half the workers in each country producing each of the goods, the United States would produce 200 million cars
Concept introduction:
Trade: The trade refers to the exchange of capital, goods, and services across different countries.
Subpart (g):
Subpart (g):
Explanation of Solution
Firstly, consider the situation without trade in which each country is producing some cars and some grains. Suppose the United States shifts its one worker from producing cars to producing grain, then that worker would produce 4 cars and 10 additional tons of grain. Now suppose, with trade, the United States offers to trade 7 tons of grain to Japan for 4 cars. The United States would encourage this because the cost of producing 4 cars in the United States is 10 tons of grain. So by trading, the United States can gain 4 cars for a cost of only 7 tons of grain. Hence, it is better off by 3 tons of grain.
The same is applicable for Japan, if Japan changes one worker from producing grain to producing cars. That worker would produce 4 more cars and 5 fewer tons of grain. Japan will take the trade because Japan will be better off by 2 tons of grain.
So with the trade and the change of one worker in both the United States and Japan, each country gets the same amount of cars as before but gets additional tons of grain (3 tons of grains for the United States and 2 tons of grains for Japan) making both countries better off.
Concept introduction:
Trade: The trade refers to the exchange of capital, goods, and services across different countries.
Want to see more full solutions like this?
Chapter 3 Solutions
Essentials of Economics (MindTap Course List)

- not use ai pleasearrow_forwardnot use ai pleasearrow_forward• Prismatic Cards: A prismatic card will be a card that counts as having every suit. We will denote, e.g., a prismatic Queen card by Q*. With this notation, 2.3045 Q would be a double flush since every card is a diamond and a heart. • Wild Cards: A wild card counts as having every suit and every denomination. Denote wild cards with a W; if there are multiple, we will denote them W₁, W2, etc. With this notation, W2 20.30054 would be both a three-of-a-kind (three 2's) and a flush (5 diamonds). If we add multiple wild cards to the deck, they count as distinct cards, so that (e.g.) the following two hands count as "different hands" when counting: W15 5Q and W255◊♡♡♣♣ In addition, 1. Let's start with the unmodified double-suited deck. (a) Call a hand a flush house if it is a flush and a full house, i.e. if all cards share a suit and there are 3 cards of one denomination and two of another. For example, 550. house. How many different flush house hands are there? 2. Suppose we add one wild…arrow_forward
- not use ai pleasearrow_forwardIn a classic oil-drilling example, you are trying to decide whether to drill for oil on a field that might or might not contain any oil. Before making this decision, you have the option of hiring a geologist to perform some seismic tests and then predict whether there is any oil or not. You assess that if there is actually oil, the geologist will predict there is oil with probability 0.85 . You also assess that if there is no oil, the geologist will predict there is no oil with probability 0.90. Please answer the two questions below, as I am trying to ensure that I am correct. 1. Why will these two probabilities not appear on the decision tree? 2. Which probabilities will be on the decision tree?arrow_forwardAsap pleasearrow_forward
- not use ai pleasearrow_forwardnot use ai pleasearrow_forwardIn this question, you will test relative purchasing parity (PPP) using the data. Use yearly data from FRED website from 1971 to 2020: (i) The Canadian Dollars to U.S. Dollar Spot Exchange Rate (ER) (ii) Consumer price index for Canada (CAN_CPI), and (iii) Consumer price index for the US (US_CPI). Inflation is measured by the consumer price index (CPI). The relative PPP equation is: AE CAN$/US$ ECAN$/US$ = π CAN - πUS Submit the Excel sheet that you worked on. 1. First, compute the percentage change in the exchange rate (left-hand side of the equation). Caculate the variable for each year from 1972 to 2020 in Column E (named Change_ER) of the Excel sheet. For example, for 1972, compute E3: (B3-B2)/B2). ER1972 ER1971 ER 1971 (in Excel, the formula in cellarrow_forward
- not use ai pleasearrow_forward8. The current price of 3M stock is $87 per share. The previous dividend paid was $5.96, and the next dividend is $6.25, assuming a growth rate of 4.86% per year. What is the forward (next 12 months) dividend yield? Show at least two decimal places, as in x.xx% %arrow_forwardJoy's Frozen Yogurt shops have enjoyed rapid growth in northeastern states in recent years. From the analysis of Joy's various outlets, it was found that the demand curve follows this pattern: Q=200-300P+1201 +657-250A +400A; where Q = number of cups served per week P = average price paid for each cup I = per capita income in the given market (thousands) Taverage outdoor temperature A competition's monthly advertising expenditures (thousands) = A; = Joy's own monthly advertising expenditures (thousands) One of the outlets has the following conditions: P = 1.50, I = 10, T = 60, A₁ = 15, A; = 10 1. Estimate the number of cups served per week by this outlet. Also determine the outlet's demand curve. 2. What would be the effect of a $5,000 increase in the competitor's advertising expenditure? Illustrate the effect on the outlet's demand curve. 3. What would Joy's advertising expenditure have to be to counteract this effect?arrow_forward
 Brief Principles of Macroeconomics (MindTap Cours...EconomicsISBN:9781337091985Author:N. Gregory MankiwPublisher:Cengage Learning
 Essentials of Economics (MindTap Course List)EconomicsISBN:9781337091992Author:N. Gregory MankiwPublisher:Cengage Learning


