EBK 3N3-EBK: FINANCIAL ANALYSIS WITH MI
8th Edition
ISBN: 9780176914943
Author: Mayes
Publisher: VST
expand_more
expand_more
format_list_bulleted
Question
Chapter 3, Problem 2P
a.
Summary Introduction
Adequate information:
| Ratio | Value | Formula |
| Current Ratio | 1.832716 | |
| Inventory Turnover | 4.414239 | |
| A/R Turnover | 8.333333 | |
| Fixed Turnover | 1.657982 | |
| LTD To Equity | 0.843090 | |
| Times Interest Earned | 1.833333 | |
| Net Profit Margin | 0.016000 | |
| Return On Total Assets | 0.018061 | |
| Return On Equity | 0.040307 |
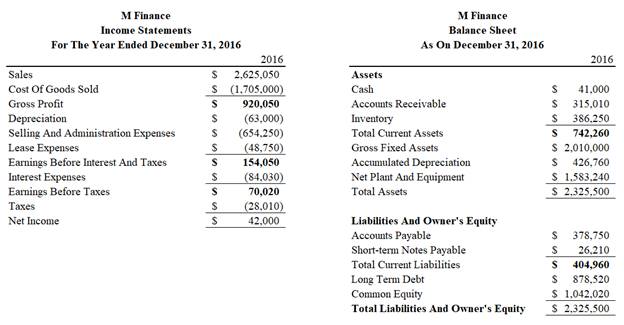
To compute: Figures marked with ‘ratio’ in the financial statements.
a.
Expert Solution
Explanation of Solution
Sequence of figures calculated and basis:
| Figure Calculated | Ratio Used for Calculation | Remark |
| Cost of Goods Sold | Inventory Turnover Ratio | Inventory value is given |
| Net Income | Value of total asset is given | |
| Equity | Net income used to calculate | |
| Long Term Debt | LTD To Equity | Equity value used |
| Sales | Net Profit Margin | Net profit used to find sales |
| Interest Expense | Times Interest Earned | Earnings before interest and tax used to calculate |
| Accounts Receivable | A/R Turnover | Sales figure already calculated |
| Net Plant and Equipment | Fixed Turnover | Sales figure used to find Average fixed assets and half of |

b)
Summary Introduction
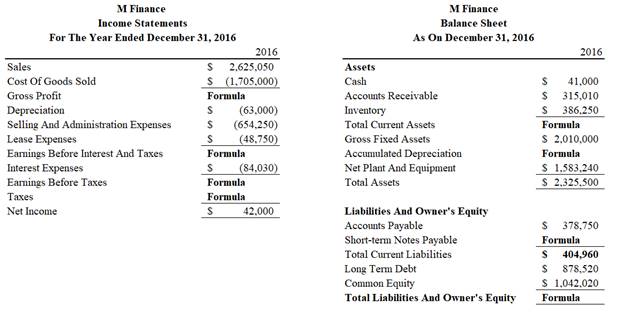
To compute: Figures marked with ‘formula’ in the financial statements.
b)
Expert Solution
Explanation of Solution
Sequence of figures calculated and basis:
| Formula to Be Calculated | Remark |
| Gross Profit | Sales − Cost Of Goods Sold |
| Earnings Before Interest and Tax | Gross Profit − Depreciation − Selling and Administration Expenses − Lease Expenses |
| Earnings Before Tax | Earnings Before Interest And Tax − Interest |
| Tax | Charged at 40 % of Earnings Before Tax |
| Total Current Assets | Cash + Accounts Receivable + Inventory |
| Accumulated Depreciation | Balancing Figure |
| Short Term Notes Payable | Balancing Figure |
| Total Liabilities and Owner’s Equity | Total Assets |

Want to see more full solutions like this?
Subscribe now to access step-by-step solutions to millions of textbook problems written by subject matter experts!
Students have asked these similar questions
Portfolio betas Personal Finance Problem Rose Berry is attempting to evaluate two possible portfolios, which
consist of the same five assets held in different proportions. She is particularly interested in using beta to compare
the risks of the portfolios, so she has gathered the data shown in the following table:
a. Calculate the betas for portfolios A and B.
b. Compare the risks of these portfolios to the market as well as to each other. Which portfolio is more risky?
a. The beta for portfolio A is
(Round to four decimal places.)
The beta for portfolio B is
(Round to four decimal places.)
b. Which portfolio is more risky? (Select the best answer below.)
A. Portfolio B
B. Portfolio A
○ C. They are the same.
No aiPlease don't answer i posted blurred image mistakely.
please comment below i will write values.
if you answer with incorrect values i will give unhelpful confirm.
finance subjPlease don't answer i posted blurred image mistakely.
please comment below i will write values.
if you answer with incorrect values i will give unhelpful confirm.
Chapter 3 Solutions
EBK 3N3-EBK: FINANCIAL ANALYSIS WITH MI
Knowledge Booster
Similar questions
- Single-payment loan repayment Personal Finance Problem A person borrows $280 that he must repay in a lump sum no more than 8 years from now. The interest rate is 7.7% annually compounded. The borrower can repay the loan at the end of any earlier year with no prepayment penalty. a. What amount will be due if the borrower repays the loan after 2 year? b. How much would the borrower have to repay after 4 years? c. What amount is due at the end of the eighth year? a. The amount due if the loan is repaid at the end of year 2 is $ (Round to the nearest cent.) b. The repayment at the end of year 4 is $ (Round to the nearest cent.) c. The amount due at the end of the eighth year is $ (Round to the nearest cent.)arrow_forwardGrowth rates Jamie El-Erian is a savvy investor. On January 1, 2010, she bought shares of stock in Amazon, Chipotle Mexican Grill, and Netflix. The table, , shows the price she paid for each stock, the price she received when she eventually sold her shares, and the date on which she sold each stock. Calculate the average annual growth in each company's share price over the time that Jamie held its stock. The average annual growth for Amazon is The average annual growth for Chipotle is The average annual growth for Netflix is %. (Round to two decimal places.) %. (Round to two decimal places.) %. (Round to two decimal places.)arrow_forwardYour portfolio has three asset classes. U.S. government T-bills account for 48% of the portfolio, large-company stocks constitute another 33%, and small-company stocks make up the remaining 19%. If the expected returns are 4.71% for the T-bills, 14.13% for the large-company stocks, and 19.85% for the small-company stocks, what is the expected return of the portfolio? The expected return of the portfolio is %. (Round to two decimal places.)arrow_forward
- betas: A, 0.4 B, 1.5 C, -0.4 D, 1.7arrow_forwardIntegrative―Risk, return, and CAPM Wolff Enterprises must consider one investment project using the capital asset pricing model (CAPM). Relevant information is presented in the following table. (Click on the icon here in order to copy the contents of the data table below into a spreadsheet.) Item Risk-free asset Market portfolio Project 4% Rate of return Beta, b 0.00 12% 1.00 1.28 a. Calculate the required rate of return for the project, given its level of nondiversifiable risk. b. Calculate the risk premium for the project, given its level of nondiverisifiable risk. a. The required rate of return for the project is %. (Round to two decimal places.) b. The risk premium for the project is %. (Round to two decimal places.)arrow_forwardSecurity market line (SML) Assume that the risk-free rate, RF, is currently 8% and that the market return, rm, is currently 15%. a. Calculate the market risk premium. b. Given the previous data, calculate the required return on asset A having a beta of 0.8 and asset B having a beta of 1.9. a. The market risk premium is ☐ %. (Round to one decimal place.) b. If the beta of asset A is 0.8, the required return for asset A is %. (Round to one decimal place.) If the beta of asset B is 1.9, the required return for asset B is %. (Round to one decimal place.)arrow_forward
- Risk and probability Micro-Pub, Inc., is considering the purchase of one of two digital cameras, R and S, each of which requires an initial investment of $4,000. Management has constructed the following table of estimates of rates of return and probabilities for pessimistic, most likely, and optimistic results: a. Determine the range for the rate of return for each of the two cameras. b. Determine the value of the expected return for each camera. c. Which camera purchase is riskier? Why? a. The range for the rate of return for camera R is %. (Round to the nearest whole number.) The range for the rate of return for camera S is ☐ %. (Round to the nearest whole number.) b. The value of the expected return for camera R is %. (Round to two decimal places.) The value of the expected return for camera S is %. (Round to two decimal places.) c. Which camera purchase is riskier? Why? (Select from the drop-down menus.) The purchase of is riskier because it has a range for the rate of return.arrow_forward4 analysts covered the stock of Flooring Chemical. One forecasts a 5% return for the coming year. The second expects the return to be -4%. The third predicts a return of 9%. The fourth expects a 1% return in the coming year. You are relatively confident that the return will be positive but not large, so you arbitrarily assign probabilities of being correct of 33%, 7%, 18%, and 42%, respectively to the analysts' forecasts. Given these probabilities, what is Flooring Chemical's expected return for the coming year?arrow_forwardWhy you would be a quality recipient of the Linda K Crandall Nutrition Scholarship.arrow_forward
- If Image is blurr then tell me . please comment below i will write values. if you answer with incorrect values i will give unhelpful confirm.arrow_forwardNormal probability distribution Assuming that the rates of return associated with a given asset investment are normally distributed; that the expected return, r, is 17.2%; and that the coefficient of variation, CV, is 0.86, answer the following questions: a. Find the standard deviation of returns, or. b. Calculate the range of expected return outcomes associated with the following probabilities of occurrence: (1) 68%, (2) 95%, (3) 99%. a. The standard deviation of returns, or, is %. (Round to three decimal places.) b. (1) The lowest possible expected return associated with the 68% probability of occurrence is %. (Round to two decimal places.) The highest possible expected return associated with the 68% probability of occurrence is decimal places.) (2) The lowest possible expected return associated with the 95% probability of occurrence is decimal places.) %. (Round to two %. (Round to two The highest possible expected return associated with the 95% probability of occurrence is decimal…arrow_forwardGeneral Finance Please don't answer i posted blurred image mistakely. please comment below i will write values. if you answer with incorrect values i will give unhelpful confirm.arrow_forward
arrow_back_ios
SEE MORE QUESTIONS
arrow_forward_ios
Recommended textbooks for you
 Excel Applications for Accounting PrinciplesAccountingISBN:9781111581565Author:Gaylord N. SmithPublisher:Cengage LearningPrinciples of Accounting Volume 2AccountingISBN:9781947172609Author:OpenStaxPublisher:OpenStax College
 Financial AccountingAccountingISBN:9781337272124Author:Carl Warren, James M. Reeve, Jonathan DuchacPublisher:Cengage Learning
 Financial AccountingAccountingISBN:9781305088436Author:Carl Warren, Jim Reeve, Jonathan DuchacPublisher:Cengage Learning

Excel Applications for Accounting Principles
Accounting
ISBN:9781111581565
Author:Gaylord N. Smith
Publisher:Cengage Learning

Principles of Accounting Volume 2
Accounting
ISBN:9781947172609
Author:OpenStax
Publisher:OpenStax College

Financial Accounting
Accounting
ISBN:9781337272124
Author:Carl Warren, James M. Reeve, Jonathan Duchac
Publisher:Cengage Learning

Financial Accounting
Accounting
ISBN:9781305088436
Author:Carl Warren, Jim Reeve, Jonathan Duchac
Publisher:Cengage Learning