
Videos
In Exercises 1–6, graph the given equations and determine how many solutions the system has, if any.
To graph: The system of equations consisting of
Explanation of Solution
Given Information:
The system of equations is;
Graph:
Consider the equations,
Rewrite the given equations,
Use the graphing calculator to determine the solution of the given system of equation,
Step 1: In the TI-83 calculator press the ON key.
Step 2: Click on the
Step 3: Write the desired equation in
Step 4: Press the
Step 5: Press the
The graph is shown below;
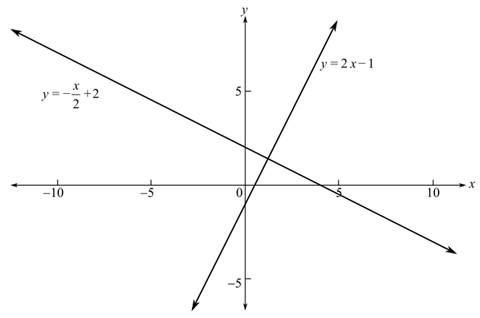
From the graph, it can be observed that the graphs of the system of equation intersect at a single point.
Interpretation:
As the graphs of the equation intersect at a single point there is a unique solution for the given system of equation.
Want to see more full solutions like this?
Chapter 3 Solutions
Finite Mathematics


- I need help making sure that I explain this part accutartly.arrow_forwardPlease help me with this question as I want to know how can I perform the partial fraction decompostion on this alebgric equation to find the time-domain of y(t)arrow_forwardJohn and Mike were offered mints. What is the probability that at least John or Mike would respond favorably? (Hint: Use the classical definition.) Question content area bottom Part 1 A.1/2 B.3/4 C.1/8 D.3/8arrow_forward
- Please help me with this question as I want to know how can I perform the partial fraction on this alebgric equation to find the time-domain of y(t)arrow_forwardEvaluate F³ - dr where ♬ = (4z, -4y, x), and C' is given by (t) = (sin(t), t, cos(t)), 0≤t≤ñ .arrow_forwardThe details of the clock sales at a supermarket for the past 6 weeks are shown in the table below. The time series appears to be relatively stable, without trend, seasonal, or cyclical effects. The simple moving average value of k is set at 2. What is the simple moving average root mean square error? Round to two decimal places. Week Units sold 1 88 2 44 3 54 4 65 5 72 6 85 Question content area bottom Part 1 A. 207.13 B. 20.12 C. 14.39 D. 0.21arrow_forward
- 5:00 PM Sat May 3 deltamath.com DeltaMath Given: ABBC and D is the midpoint of AC. Prove: ABD ≈ ACBD. ← Back to Home Deltamath Regents Review Week 3 Due: May 9 at 8:00 PM Grade: 97% Step Statement AB ≈ BC Reason 1 Given D is the midpoint of AC 2 BD BD 3 ADDC Calculating Volume (Mixed) Volume of Oblique Solids Volume, Density, and Unit 5 4 AABC is an isosceles triangle ZAZC Conversions (Level 1) Triangle Congruence Criteria try ZAD =/ DC Basic Triangle Proofs (Congruence Only - No CPCTC) Triangle Proofs (Reasons Only) Calculator Aseret Martinez Domi... Log Out Reflexive Property A midpoint divides a segment into two congruent segments The triangle has two congruent sides In a triangle, angles opposite of congruent sides are congruent An angle bisector divides an angle into two congruent angles B * A Ꭰ Note: the segment AC is a straight segment. 86%arrow_forwardEvaluate the following expression and show your work to support your calculations. a). 6! b). 4! 3!0! 7! c). 5!2! d). 5!2! e). n! (n - 1)!arrow_forwardLANDMARKS Stonehenge is a British landmark made of huge stones arranged in a circular pattern that reflects the movements of Earth and the moon. The diagram shows that the angle formed by the north/south axis and the line aligned from the station stone to the northmost moonrise position measures 23.5°. a. Find measure of arc BC. b. Is arc ABC semicircle? Explain. c. If the circle measures about 100 feet across, approximately how far would you walk around the circle from point B to point sarsen circle B station stone trilithons horseshoe 71° 23.5° farthest north moonrise Sarrow_forward
- Mid-Term Review Find the formula for (f + g)(x). f(x) = x² - 10x + 25 and g(x) = x² - 10x + 24 (f + g) (x) = [ 2 ]x² X + DELL Skip Sarrow_forwardAmy and Samiha have a hat that contains two playing cards, one ace and one king. They are playing a game where they randomly pick a card out of the hat four times, with replacement. Amy thinks that the probability of getting exactly two aces in four picks is equal to the probability of not getting exactly two aces in four picks. Samiha disagrees. She thinks that the probability of not getting exactly two aces is greater. The sample space of possible outcomes is listed below. A represents an ace, and K represents a king. Who is correct?arrow_forwardConsider the exponential function f(x) = 12x. Complete the sentences about the key features of the graph. The domain is all real numbers. The range is y> 0. The equation of the asymptote is y = 0 The y-intercept is 1arrow_forward
 Algebra & Trigonometry with Analytic GeometryAlgebraISBN:9781133382119Author:SwokowskiPublisher:Cengage
 College Algebra (MindTap Course List)AlgebraISBN:9781305652231Author:R. David Gustafson, Jeff HughesPublisher:Cengage Learning
 Algebra: Structure And Method, Book 1AlgebraISBN:9780395977224Author:Richard G. Brown, Mary P. Dolciani, Robert H. Sorgenfrey, William L. ColePublisher:McDougal Littell