Concept explainers
Videos
In Exercises 1-4, graph the given quadratic function. Give each function’s domain and range.
1. f(x) = (x − 3)2 − 4
To sketch: The graph of the function and then find the domain and range of the function
Answer to Problem 1MC
The domain of the function is
The range of the function is
Explanation of Solution
Definition used:
The domain of a function is a set of real values of the independent variable such that the corresponding dependent values also will be real.
The range of a function is defined as a set of all possible functional values, which is denoted by
Calculation:
Consider the quadratic function
It is known that the standard form of the quadratic equation is
Compare the given quadratic equation
Thus, the vertex of the parabola is
Find the x intercept by substituting 0 for
The x intercepts are 1 and 5.
That is, the parabola passes through
Find the y intercept by substituting 0 for x in
The y intercept is 5.
That is, the parabola passes through
Use the above information to draw the graph of the function
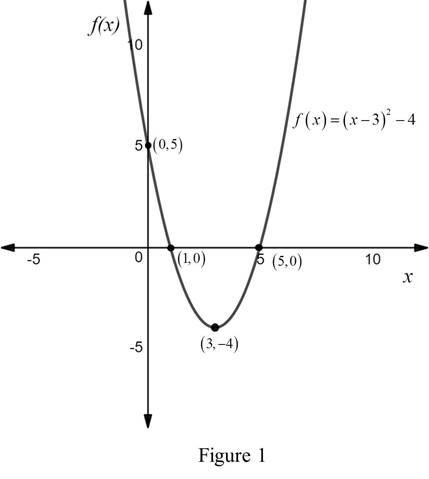
From Figure 1, it is observed that the parabola is open upward and the vertex of the parabola is
For all the real values of x, the function
Therefore, there is no restriction for the domain of the function.
Hence, the domain of the function is
Note that, the vertex of the parabola is
Since y coordinate of the vertex is −4, the functional values will fall on or above −4.
Hence, the range of the function is
Want to see more full solutions like this?
Chapter 3 Solutions
COLLEGE ALGEBRA ESSENTIALS-MYMATHLAB


- please Solve questions by Course Name( Ordinary Differential Equations II 2)arrow_forwardInThe Northern Lights are bright flashes of colored light between 50 and 200 miles above Earth. Suppose a flash occurs 150 miles above Earth. What is the measure of arc BD, the portion of Earth from which the flash is visible? (Earth’s radius is approximately 4000 miles.)arrow_forwarde). n! (n - 1)!arrow_forward
- Suppose you flip a fair two-sided coin four times and record the result. a). List the sample space of this experiment. That is, list all possible outcomes that could occur when flipping a fair two-sided coin four total times. Assume the two sides of the coin are Heads (H) and Tails (T).arrow_forwarde). n! (n - 1)!arrow_forwardEvaluate the following expression and show your work to support your calculations. a). 6! b). 4! 3!0! 7! c). 5!2! d). 5!2! e). n! (n - 1)!arrow_forward
- Amy and Samiha have a hat that contains two playing cards, one ace and one king. They are playing a game where they randomly pick a card out of the hat four times, with replacement. Amy thinks that the probability of getting exactly two aces in four picks is equal to the probability of not getting exactly two aces in four picks. Samiha disagrees. She thinks that the probability of not getting exactly two aces is greater. The sample space of possible outcomes is listed below. A represents an ace, and K represents a king. Who is correct?arrow_forwardConsider the exponential function f(x) = 12x. Complete the sentences about the key features of the graph. The domain is all real numbers. The range is y> 0. The equation of the asymptote is y = 0 The y-intercept is 1arrow_forwardThe graph shows Alex's distance from home after biking for x hours. What is the average rate of change from -1 to 1 for the function? 4-2 о A. -2 О B. 2 О C. 1 O D. -1 ty 6 4 2 2 0 X 2 4arrow_forward
 College Algebra (MindTap Course List)AlgebraISBN:9781305652231Author:R. David Gustafson, Jeff HughesPublisher:Cengage Learning
 Glencoe Algebra 1, Student Edition, 9780079039897...AlgebraISBN:9780079039897Author:CarterPublisher:McGraw Hill
 Big Ideas Math A Bridge To Success Algebra 1: Stu...AlgebraISBN:9781680331141Author:HOUGHTON MIFFLIN HARCOURTPublisher:Houghton Mifflin Harcourt
 College AlgebraAlgebraISBN:9781305115545Author:James Stewart, Lothar Redlin, Saleem WatsonPublisher:Cengage Learning
 Algebra and Trigonometry (MindTap Course List)AlgebraISBN:9781305071742Author:James Stewart, Lothar Redlin, Saleem WatsonPublisher:Cengage Learning