
Concept explainers
Videos
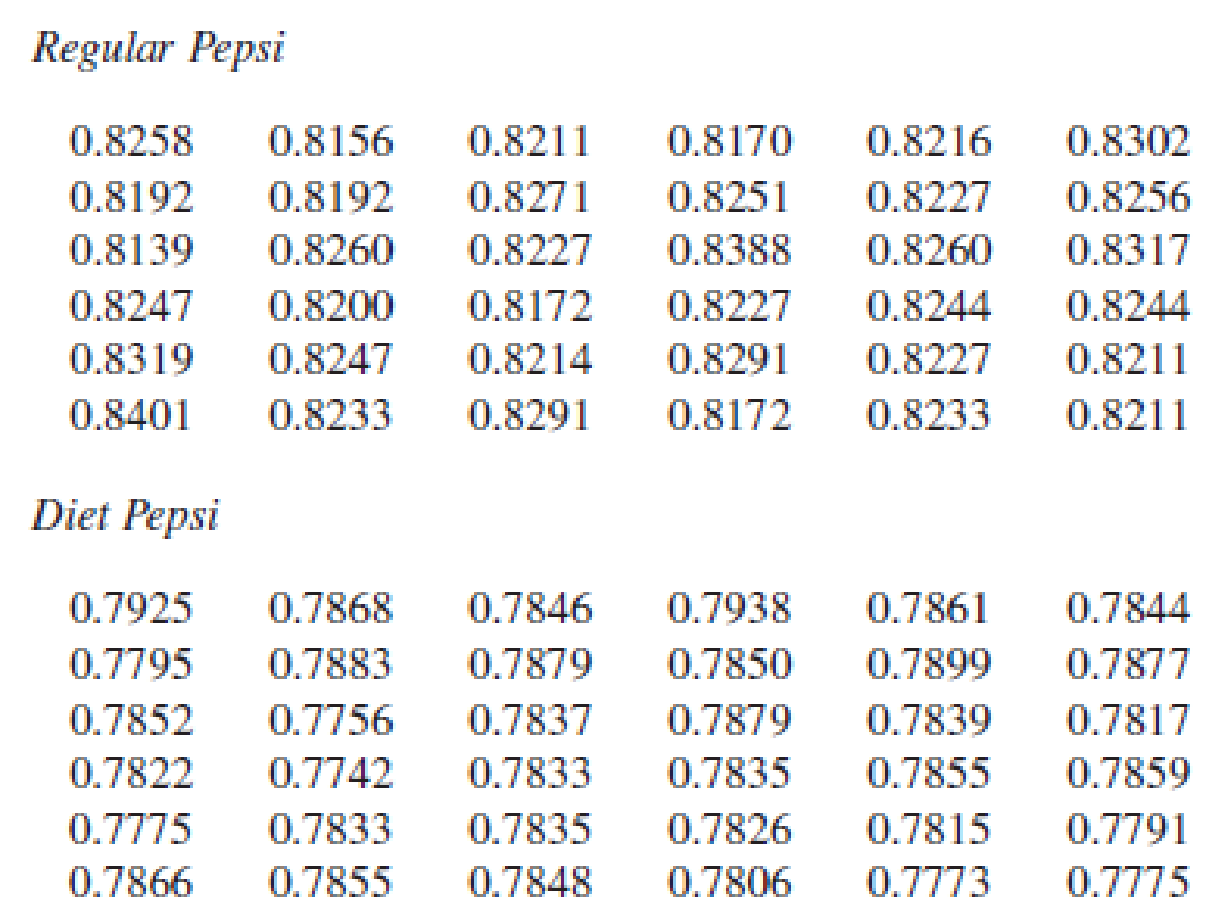
Listed below are measured weights (in pounds) of the contents in samples of cans of regular Pepsi and Diet Pepsi. Use these data for Exercises 1–3
1.
- a. Construct a frequency table for the weights of regular Pepsi. Use these bins:
0.8130–0.8179
0.8180–0.8229
0.8230–0.8279
0.8280–0.8329
0.8330–0.8379
0.8380–0.8429
- b. Construct a frequency table for the weights of Diet Pepsi. Use these bins:
0.7740–0.7779
0.7780–0.7819
0.7820–0.7859
0.7860–0.7899
0.7900–0.7939
- c. Compare the frequency tables from parts (a) and (b). What notable differences are there? How can those notable differences be explained?
a.
Create a frequency table for the weights of regular Pepsi using the given bins.
Answer to Problem 1CRE
The relative frequency table for the weights of regular Pepsi using the given bins is as follows,
| Weights | Frequency |
| 0.8130–0.8179 | 5 |
| 0.8180–0.8229 | 12 |
| 0.8230–0.8279 | 12 |
| 0.8280–0.8329 | 5 |
| 0.8330–0.8379 | 0 |
| 0.8380-0.8429 | 2 |
| Total | 36 |
Explanation of Solution
Calculation
The given information is that,the data represents the weights (in pounds) of the contents in samples of cans of Regular Pepsi and Diet Pepsi.
From the data it is observed that, the values are ranging from 0.8139 to 0.8401. One-way to arrange the data in a group with these bins are classify the weights into different groups. Those are, 0.8130-0.8179, 0.8180-0.8229, 0.8230-0.8279, 0.8280-0.8329, 0.8330-0.8379 and 0.8380-0.8429.
Now, count the frequency for each bin. That is, 5 for bin 0.8130-0.8176 because in that range there are 5 cans and for bin 0.8180-0.8229, 12. Similarly the remaining frequencies are obtained and tabulated below.
The frequency table is as follows,
| Weights | Frequency |
| 0.8130–0.8179 | 5 |
| 0.8180–0.8229 | 12 |
| 0.8230–0.8279 | 12 |
| 0.8280–0.8329 | 5 |
| 0.8330–0.8379 | 0 |
| 0.8380–0.8429 | 2 |
| Total | 36 |
b.
Create a frequency table for the weights of Diet Pepsi.
Answer to Problem 1CRE
The frequency table for the weights of Diet Pepsi is as follows,
| Weights | Frequency |
| 0.7740–0.7779 | 5 |
| 0.7780–0.7819 | 5 |
| 0.7820–0.7859 | 16 |
| 0.7860–0.7899 | 8 |
| 0.7900–0.7939 | 2 |
| Total | 36 |
Explanation of Solution
Calculation
From the data it is observed that, the values are ranging from 0.7742 to 0.7938. The groups for the weights of different bins are 0.7740-0.7779, 0.7780-0.7819, 0.7820-0.7859, 0.7860-0.7899 and 0.7900-0.7939.
Now, count the frequency for each bin. That is, 5 for bin 0.7740-0.7779 because in that range there are 5 cans and for bin 0.7780-0.7819, 5. Similarly the frequencies for remaining bins are obtained and tabulated below.
The frequency table is as follows,
| Weights | Frequency |
| 0.7740–0.7779 | 5 |
| 0.7780–0.7819 | 5 |
| 0.7820–0.7859 | 16 |
| 0.7860–0.7899 | 8 |
| 0.7900–0.7939 | 2 |
| Total | 36 |
c.
Explain whether there are any notable differences by comparing the frequency tables from parts (a) and (b).
Explanation of Solution
From the frequencies tables of parts (a) and (b) it can be observed that, the regular Pepsi weights are more than the diet Pepsi weights because of the sugar levels in the regular Pepsi. But the volumes of both type cans are approximately same.
Want to see more full solutions like this?
Chapter 3 Solutions
Statistical Reasoning for Everyday Life (5th Edition)
Additional Math Textbook Solutions
Pathways To Math Literacy (looseleaf)
Mathematics for the Trades: A Guided Approach (11th Edition) (What's New in Trade Math)
Elementary Statistics: Picturing the World (7th Edition)
Basic College Mathematics


- Questions An insurance company's cumulative incurred claims for the last 5 accident years are given in the following table: Development Year Accident Year 0 2018 1 2 3 4 245 267 274 289 292 2019 255 276 288 294 2020 265 283 292 2021 263 278 2022 271 It can be assumed that claims are fully run off after 4 years. The premiums received for each year are: Accident Year Premium 2018 306 2019 312 2020 318 2021 326 2022 330 You do not need to make any allowance for inflation. 1. (a) Calculate the reserve at the end of 2022 using the basic chain ladder method. (b) Calculate the reserve at the end of 2022 using the Bornhuetter-Ferguson method. 2. Comment on the differences in the reserves produced by the methods in Part 1.arrow_forwardQuestions An insurance company's cumulative incurred claims for the last 5 accident years are given in the following table: Development Year Accident Year 0 2018 1 2 3 4 245 267 274 289 292 2019 255 276 288 294 2020 265 283 292 2021 263 278 2022 271 It can be assumed that claims are fully run off after 4 years. The premiums received for each year are: Accident Year Premium 2018 306 2019 312 2020 318 2021 326 2022 330 You do not need to make any allowance for inflation. 1. (a) Calculate the reserve at the end of 2022 using the basic chain ladder method. (b) Calculate the reserve at the end of 2022 using the Bornhuetter-Ferguson method. 2. Comment on the differences in the reserves produced by the methods in Part 1.arrow_forwardFrom a sample of 26 graduate students, the mean number of months of work experience prior to entering an MBA program was 34.67. The national standard deviation is known to be18 months. What is a 90% confidence interval for the population mean? Question content area bottom Part 1 A 9090% confidence interval for the population mean is left bracket nothing comma nothing right bracketenter your response here,enter your response here. (Use ascending order. Round to two decimal places as needed.)arrow_forward
- A test consists of 10 questions made of 5 answers with only one correct answer. To pass the test, a student must answer at least 8 questions correctly. (a) If a student guesses on each question, what is the probability that the student passes the test? (b) Find the mean and standard deviation of the number of correct answers. (c) Is it unusual for a student to pass the test by guessing? Explain.arrow_forwardIn a group of 40 people, 35% have never been abroad. Two people are selected at random without replacement and are asked about their past travel experience. a. Is this a binomial experiment? Why or why not? What is the probability that in a random sample of 2, no one has been abroad? b. What is the probability that in a random sample of 2, at least one has been abroad?arrow_forwardQuestions An insurance company's cumulative incurred claims for the last 5 accident years are given in the following table: Development Year Accident Year 0 2018 1 2 3 4 245 267 274 289 292 2019 255 276 288 294 2020 265 283 292 2021 263 278 2022 271 It can be assumed that claims are fully run off after 4 years. The premiums received for each year are: Accident Year Premium 2018 306 2019 312 2020 318 2021 326 2022 330 You do not need to make any allowance for inflation. 1. (a) Calculate the reserve at the end of 2022 using the basic chain ladder method. (b) Calculate the reserve at the end of 2022 using the Bornhuetter-Ferguson method. 2. Comment on the differences in the reserves produced by the methods in Part 1.arrow_forward
- To help consumers in purchasing a laptop computer, Consumer Reports calculates an overall test score for each computer tested based upon rating factors such as ergonomics, portability, performance, display, and battery life. Higher overall scores indicate better test results. The following data show the average retail price and the overall score for ten 13-inch models (Consumer Reports website, October 25, 2012). Brand & Model Price ($) Overall Score Samsung Ultrabook NP900X3C-A01US 1250 83 Apple MacBook Air MC965LL/A 1300 83 Apple MacBook Air MD231LL/A 1200 82 HP ENVY 13-2050nr Spectre XT 950 79 Sony VAIO SVS13112FXB 800 77 Acer Aspire S5-391-9880 Ultrabook 1200 74 Apple MacBook Pro MD101LL/A 1200 74 Apple MacBook Pro MD313LL/A 1000 73 Dell Inspiron I13Z-6591SLV 700 67 Samsung NP535U3C-A01US 600 63 a. Select a scatter diagram with price as the independent variable. b. What does the scatter diagram developed in part (a) indicate about the relationship…arrow_forwardTo the Internal Revenue Service, the reasonableness of total itemized deductions depends on the taxpayer’s adjusted gross income. Large deductions, which include charity and medical deductions, are more reasonable for taxpayers with large adjusted gross incomes. If a taxpayer claims larger than average itemized deductions for a given level of income, the chances of an IRS audit are increased. Data (in thousands of dollars) on adjusted gross income and the average or reasonable amount of itemized deductions follow. Adjusted Gross Income ($1000s) Reasonable Amount ofItemized Deductions ($1000s) 22 9.6 27 9.6 32 10.1 48 11.1 65 13.5 85 17.7 120 25.5 Compute b1 and b0 (to 4 decimals).b1 b0 Complete the estimated regression equation (to 2 decimals). = + x Predict a reasonable level of total itemized deductions for a taxpayer with an adjusted gross income of $52.5 thousand (to 2 decimals). thousand dollarsWhat is the value, in dollars, of…arrow_forwardK The mean height of women in a country (ages 20-29) is 63.7 inches. A random sample of 65 women in this age group is selected. What is the probability that the mean height for the sample is greater than 64 inches? Assume σ = 2.68. The probability that the mean height for the sample is greater than 64 inches is (Round to four decimal places as needed.)arrow_forward
- In a survey of a group of men, the heights in the 20-29 age group were normally distributed, with a mean of 69.6 inches and a standard deviation of 4.0 inches. A study participant is randomly selected. Complete parts (a) through (d) below. (a) Find the probability that a study participant has a height that is less than 68 inches. The probability that the study participant selected at random is less than 68 inches tall is 0.4. (Round to four decimal places as needed.) 20 2arrow_forwardPEER REPLY 1: Choose a classmate's Main Post and review their decision making process. 1. Choose a risk level for each of the states of nature (assign a probability value to each). 2. Explain why each risk level is chosen. 3. Which alternative do you believe would be the best based on the maximum EMV? 4. Do you feel determining the expected value with perfect information (EVWPI) is worthwhile in this situation? Why or why not?arrow_forwardQuestions An insurance company's cumulative incurred claims for the last 5 accident years are given in the following table: Development Year Accident Year 0 2018 1 2 3 4 245 267 274 289 292 2019 255 276 288 294 2020 265 283 292 2021 263 278 2022 271 It can be assumed that claims are fully run off after 4 years. The premiums received for each year are: Accident Year Premium 2018 306 2019 312 2020 318 2021 326 2022 330 You do not need to make any allowance for inflation. 1. (a) Calculate the reserve at the end of 2022 using the basic chain ladder method. (b) Calculate the reserve at the end of 2022 using the Bornhuetter-Ferguson method. 2. Comment on the differences in the reserves produced by the methods in Part 1.arrow_forward
 Holt Mcdougal Larson Pre-algebra: Student Edition...AlgebraISBN:9780547587776Author:HOLT MCDOUGALPublisher:HOLT MCDOUGAL