
Concept explainers
Videos
The Tesla Model S, one of the most sought-after luxury cars, is produced in Tesla’s Freemont factory in California. The production process can be broken up into the following subprocesses.
Stamping: In the stamping process, coils of aluminum are unwound, cut into level pieces of sheet metal, and then inserted into stamping presses that shape the metal according to the geometry of the Model S. The presses can shape a sheet of metal in roughly 6 seconds.
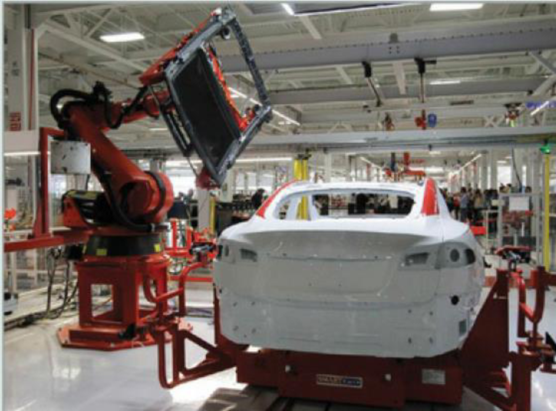
Subassembly: The various pieces of metal are put together using a combination of joining techniques, including welding and adhesion. This creates the body of the vehicle.
Paint: The body of the vehicle is then moved to the paint shop. After painting is completed, the body moves through a 350° oven to cure the paint, followed by a sanding operation that ensures a clean surface.
General assembly: After painting, the vehicle body is moved to the final assembly area. Here, assembly workers and assembly robots insert the various subassemblies, such as the wiring, the dash board, the power train and the motor, the battery pack, and the seats.
Quality testing: Before being shipped to the customer, the now-assembled car is tested for its quality. It is driven on a rolling road, a test station that is basically a treadmill for cars that mimics driving on real streets.
Overall, the process is equipped with 160 robots and 3000 employees. The process produces some 500 vehicles each week. It takes a car about 3–5 days to move from the beginning of the process to the end.
Imagine you could take a tour of the Tesla plant. To prepare for this tour, draw a simple process flow diagram of the operation.
What is the cycle time of the process (assume two shifts of 8 hours each and 5 days a week of operation)?
Want to see the full answer?
Check out a sample textbook solution
Chapter 3 Solutions
OPERATIONS MANAGEMENT W/ 360 DAY CONNECT
Additional Business Textbook Solutions
Fundamentals of Financial Accounting
Principles of Operations Management: Sustainability and Supply Chain Management (10th Edition)
Engineering Economy (17th Edition)
Operations Management: Processes and Supply Chains (12th Edition) (What's New in Operations Management)
Horngren's Cost Accounting: A Managerial Emphasis (16th Edition)
Horngren's Accounting (12th Edition)


- 2. Describe three types of risks commonly faced by entrepreneurs.arrow_forwardDefine risk management and explain its importance in a small business.arrow_forward1. Define risk management and explain its importance in a small business. 2. Describe three types of risks commonly faced by entrepreneurs. 3. Explain the purpose of a risk register. 4. List and briefly describe four risk response strategies. (5 marks) (6 marks) (4 marks) (8 marks) 5. Explain how social media can pose a risk to small businesses. (5 marks) 6. Identify and describe any four hazard-based risks. (8 marks) 7. Mention four early warning indicators that a business may be at risk. (4 marks)arrow_forward
- State whether each of the following statements is TRUE or FALSE. 1. Risk management involves identifying, analysing, and mitigating risks. 2. Hazard risks include interest rate fluctuations. 3. Entrepreneurs should avoid all forms of risks. 4. SWOT analysis is a tool for risk identification. 5. Scenario building helps visualise risk responses. 6. Risk appetite defines how much risk an organisation is willing to accept. 7. Diversification is a risk reduction strategy. 8. A risk management framework must align with business goals. 9. Political risk is only relevant in unstable countries. 10. All risks can be eliminated through insurance.arrow_forward9. A hazard-based risk includes A. Political instability B. Ergonomic issues C. Market demand D. Taxation changesarrow_forward8. Early warning indicators help businesses to A. Avoid legal actions B. Grow rapidly C. Detect potential risks D. Hire employees 9. A hazard-based risk includes A. Political instability B. Ergonomic issues C. Market demand D. Taxation changesarrow_forward
- 10. Which risk category refers to taking advantage of a new opportunity despite potential challenges? A. Hazard B. Uncertainty C. Opportunity D. Strategicarrow_forward6. A business continuity plan is mainly used to_ A. Increase profits B. Handle daily tasks C. Prepare for disruptions D. Advertise services 7. What is the role of a risk owner? A. To finance the risk B. To monitor and manage a specific risk C. To create risks D. To avoid planning 8. Early warning indicators help businesses to_ A. Avoid legal actions B. Grow rapidly C. Detect potential risks D. Hire employees 9. A hazard-based risk includes_ A. Political instability B. Ergonomic issues C. Market demand D. Taxation changesarrow_forwardFill in the table below with the activity times after crashing to show the resulting schedule. (Enter your responses as whole numbers.) Activity A B с Time according to schedule (weeks) Activity F G H Time according to schedule (weeks) D E COEarrow_forward
- Given the information below, estimate the probability that the noncritical path B-F-G will take more than 20 weeks. Hint: Subtract from 1.0 the probability that B-F-G will take 20 weeks or less. Refer to the standard normal table. Activity A Expected Time (weeks) Variance 3.5 1.00 BCDE 5.5 0.96 C 4.0 0.45 12.0 1.78 6.5 2.25 F G 9.0 2.78 4.5 0.69 The probability that this path will take more than 20 weeks to complete is (Enter your response rounded to four decimal places.)arrow_forwardYou are the event manager of a wedding project that is behind schedule and over budget. The client has requested some additional features that were not in the original scope. How would you prioritize the additional features requested by the client? What strategies would you employ to adjust the project plan and budget to accommodate these changes effectively? Additionally, what specific tools and techniques would you utilize to monitor and control the progress and ensure the quality of the project?arrow_forwardCurrently a company that designs Web sites has five customers in its backlog. The time since the order arrived, processing time, and promised due dates are given in the following table. The customers are ready to be scheduled today, which is the start of day 190. Time Since Order Arrived Customer (days ago) Processing Time (days) Due Date (days from now) A 3 24 58 B 2 32 100 с 10 20 26 D E 8 6 12 28 50 66 a. Develop separate schedules by using the FCFS and EDD rules. Compare the schedules on the basis of average flow time and average days past due. Using the FCFS (first come, first served) decision rule for sequencing the customers, the order is: Sequence Customer 1 2 3 4 5arrow_forward
 Practical Management ScienceOperations ManagementISBN:9781337406659Author:WINSTON, Wayne L.Publisher:Cengage,
 Contemporary MarketingMarketingISBN:9780357033777Author:Louis E. Boone, David L. KurtzPublisher:Cengage Learning