FINANCIAL STATEMENTS, CASH FLOW, AND TAXES Laiho Industries’s 2017 and 2018
| 2018 | 2017 | |
| Cash | $ 102,850 | $ 89,725 |
| Accounts receivable | 103,365 | 85,527 |
| Inventories | 38,444 | 34,982 |
| Total current assets | $ 244,659 | $ 210,234 |
| Net fixed assets | 67,165 | 42,436 |
| Total assets | $ 311,824 | $ 252,670 |
| Accounts payable | $ 30,761 | $ 23,109 |
| Accruals | 30,477 | 22,656 |
| Notes payable | 16,717 | 14,217 |
| Total current liabilities | $ 77,955 | $ 59,982 |
| Long-term debt | 76,264 | 63,914 |
| Total liabilities | $ 154,219 | $ 123,896 |
| Common stock | 100,000 | 90,000 |
| 57,605 | 38,774 | |
| Total common equity | $ 157,605 | $ 128,774 |
| Total liabilities and equity | $ 311,824 | $ 252,670 |
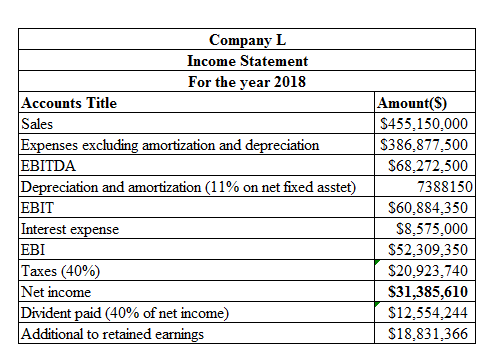
- a. Sales for 2018 were $ 455,150,000, and EBITDA was 15% of sales Furthermore,
depreciation and amortization were 11%. of net fixed assets, interest was $ 8,575,000, the corporate tax rate was 40%, and Laiho pays 40% of its net income as dividends Given this information. construct the firm’s 2018 income statement. - b. Construct the statement of stockholders’ equity for the year ending December 31, 2018, and the 2018 statement of cash flows.
- c. Calculate 2017 and 2018 net operating working capital (NOWC) and 2018
free cash flow (FCF). Assume the firm has no excess cash. - d. If Laiho increased its dividend payout ratio, what effect would this have on corporate taxes paid’ What effect would this have on taxis, paid by the company’s shareholders?
- e. Assume that the firm’s after-tax cost of capital is 10 5%. What is the firm’s 2018 EVA?
- f. Assume that the firm’s stock price is S22 per share and that at year-end 2018 the firm has 10 million shares outstanding. What is the firm’s MVA at year-end 2018?
a.
To prepare: The income statement of company L for 2014.
Financial Statements:
It refer to the statements, which are prepared by the firm at the closure of the accounting period in particular formats and are prescribed in the accounting to show its financial position.
Income Statement:
A part of financial statements that list the income and expenses of the business for an accounting year is called the income statement. It is prepared at the closure of the accounting period to know the profitability of the business.
Explanation of Solution
Given information:
Sales is $455,150,000 for the year 2018.
EBITDA is 15% on sales.
11% of depreciation and amortization on net fixed asset.
Interest is $8,575,000.
40% tax.
40% of the divided on net income.
Calculation on income statement using the spreadsheet is as follows:

Table (1)
Therefore, Company L has a net income of $31,385,610.
b.
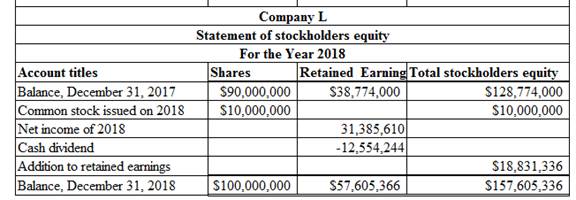
To prepare: The statement of stockholders’ equity of Company L for 2018.
Statement of stockholders’ equity:
The statement of stockholders’ equity reports the opening and closing balance of stockholder’s equity with the changes incurred during the accounting period.
Statement of cash flow:
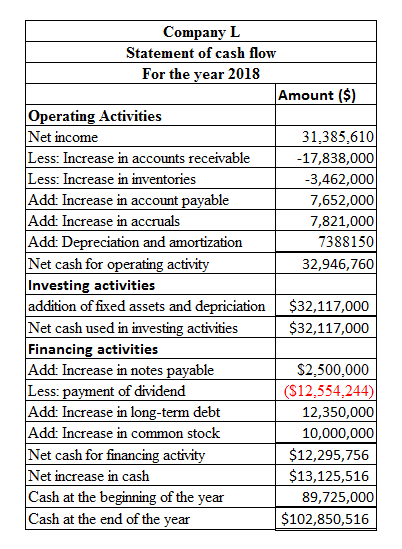
The statement of cash flow is a part of fiscal statements those are comprised in the yearly report of a company. It reports the cash generated or used by the business in a specified period.
Explanation of Solution
The calculation of statement of stockholders’ equity using the spreadsheet for the year 2018 is as follows:

Table (2)
The calculation of statement of cash flow using the spreadsheet is as follows:

Table (3)
c.
To compute: The net operating working capital for 2017 and 2018, and the free cash flow for 2018.
The net operating working capital:
The current assets and current liabilities of active business operations are known as the operating current assets and the operating current liabilities, respectively. The difference between these two is known as the net operating working capital.
Free Cash Flow:
The performance of a company’s operations is also evaluated by its cash generation abilities. The term used to depict and report that ability is known as the free cash flow. Capital expenditures are deducted from operating cash flow to compute the free cash flow.
Explanation of Solution
The calculation of net operating working capital is as follows:
Given information:
Current assets in 2017 are $210,234,000.
Current liabilities in 2017 are $59,982,000.
Current assets in 2018 are $244,659,000
Current liabilities in 2018 are $77,955,000.
For the year 2017,
The formula to compute the net operating current assets is as follows:
Compute the net operating current assets:
Hence, the net operating current asset is $210,234,000.
For the year 2017,
The formula to compute the net operating current liabilities is as follows:
Compute the net operating current liabilities:
Hence, the net operating current liabilities is $45,765,000.
For the year 2018,
The formula to compute the net operating current assets is as follows:
Compute the net operating current assets:
Hence, the net operating current asset is $244,659,000.
For the year 2018,
The formula to compute the net operating current liabilities is as follows:
Compute the net operating current liabilities:
Hence, the net operating current liabilities is $61,238,000.
For 2017,
The formula to compute the net operating working capital is as follows:
Substitute $210,234 for the net operating current assets and $45,765,000 for the net operating current liabilities.
Hence, the net operating working capital for the year 2017 is $164,469,000.
For 2018,
The formula to compute the net operating working capital is as follows:
Substitute $244,659 for current assets and $77,955 for the current liabilities.
Hence, the net operating working capital for the year 2018 is $183,421,000.
Calculation of Free cash flow:
Given information:
EBIT is $60,884,358 (refer part a).
The tax rate is 40%.
Depreciation is $7,388,150 (refer part a).
Capital expenditure is $32,117,000 (refer part b).
Increase in the net operating working capital is $18,952,000
The formula to compute the free cash flow is as follows:
Substitute $60,884 for EBIT, 40% for tax rate, $7,388 for depreciation, $32,117 for capital expenditure and $18,952,000.
Hence, the free cash flow for the year 2018 is -$7,150,235.2.
d.
To analyze: The effect of increased dividend payment on company’s tax liability and stockholders’ liability.
Dividend Payout Ratio:
The ratio that reflects the dividends paid as the proportion of net income earned by a company during a specified time period is called the dividend payout ratio.
Answer to Problem 19SP
There will be no change in the taxes paid by the company but the stockholders’ tax liability will increase with the increase in the dividend payout.
Explanation of Solution
- The dividend payment is calculated after the tax is calculated. Therefore, there will be no change in the tax amount if the dividend payment is changed.
- The dividend is an income for the stockholders and taxable for them. Therefore their tax liability will increase if the dividend payout is increased.
Therefore, the increased dividend payment will have no change in the company’s tax liability but it will increase the stockholders’ tax liability.
e.
To compute: The economic value added (EVA) for 2018.
Explanation of Solution
Given information:
EBIT is 60,884,350.
The capital invested is $250,586,000
The cost of capital is 10.5%.
The formula to compute EVA is as follows:
Substitute $31,386 for the earnings after tax, $157,605 for the capital invested, and 10.5% for the cost of capital.
Hence, the EVA for the year 2018 is $10,219,080.
f.
To compute: The market value added (MVA) for 2018.
Explanation of Solution
Given information:
The market price of a share is $22.
Outstanding shares are 10 million.
Common equity is $157,605,000.
The formula to compute MVA is as follows:
Substitute $22 for the market price of the share, $157,605 for the capital invested, and 10,000,000 for the number of shares.
Hence, the MVA for the year 2018 is $62,395,000.
Want to see more full solutions like this?
Chapter 3 Solutions
Fundamentals of Financial Management (MindTap Course List)
- A sporting goods manufacturer has decided to expand into a related business. Management estimates that to build and staff a facility of the desired size and to attain capacity operations would cost $450 million in present value terms. Alternatively, the company could acquire an existing firm or division with the desired capacity. One such opportunity is a division of another company. The book value of the division’s assets is $250 million and its earnings before interest and tax are presently $50 million. Publicly traded comparable companies are selling in a narrow range around 12 times current earnings. These companies have book value debt-to-asset ratios averaging 40 percent with an average interest rate of 10 percent. a. Using a tax rate of 34 percent, estimate the minimum price the owner of the division should consider for its sale. b. What is the maximum price the acquirer should be willing to pay? c. Does it appear that an acquisition is feasible? Why or why not? d. Would a 25…arrow_forwardLarry Davis borrows $80,000 at 14 percent interest toward the purchase of a home. His mortgage is for 25 years. a. How much will his annual payments be? (Although home payments are usually on a monthly basis, we shall do our analysis on an annual basis for ease of computation. We will get a reasonably accurate answer.) b. How much interest will he pay over the life of the loan? c. How much should be willing to pay to get out of a 14 percent mortgage and into a 10 percent mortgage with 25 years remaining on the mortgage? Assume current interest rates are 10 percent. Carefully consider the time value of money. Disregard taxes.arrow_forwardYou are chairperson of the investment fund for the local closet. You are asked to set up a fund of semiannual payments to be compounded semiannually to accumulate a sum of $250,000 after nine years at a 10 percent annual rate (18 payments). The first payment into the fund is to take place six months from today, and the last payment is to take place at the end of the ninth year. Determine how much the semiannual payment should be. (a) On the day, after the sixth payment is made (the beginning of the fourth year), the interest rate goes up to a 12 percent annual rate, and you can earn a 12 percent annual rate on funds that have been accumulated as well as all future payments into the funds. Interest is to be compounded semiannually on all funds. Determine how much the revised semiannual payments should be after this rate change (there are 12 payments and compounding dates). The next payment will be in the middle of the fourth year.arrow_forward
- If your Uncle borrows $60,000 from the bank at 10 percent interest over the seven-year life of the loan, what equal annual payments must be made to discharge the loan, plus pay the bank its required rate of interest? How much of his first payment will be applied to interest? To principal? How much of his second payment will be applied to each?arrow_forwardQ1: You are an analyst in charge of valuing common stocks. You have been asked to value two stocks. The first stock NEWER Inc. just paid a dividend of $6.00. The dividend is expected to increase by 60%, 45%, 30% and 15% per year, respectively, in the next four years. Thereafter, the dividend will increase by 4% per year in perpetuity. Calculate NEWER’s expected dividend for t = 1, 2, 3, 4 and 5.The required rate of return for NEWER stock is 14% compounded annually.What is NEWER’s stock price?The second stock is OLDER Inc. OLDER Inc. will pay its first dividend of $10.00 three (3) years from today. The dividend will increase by 30% per year for the following four (4) years after its first dividend payment. Thereafter, the dividend will increase by 3% per year in perpetuity. Calculate OLDER’s expected dividend for t = 1, 2, 3, 4, 5, 6, 7 and 8.The required rate of return for OLDER stock is 16% compounded annually.What is OLDER’s stock price?Now assume that both stocks have a required…arrow_forwardQ1: Blossom is 30 years old. She plans on retiring in 25 years, at the age of 55. She believes she will live until she is 105. In order to live comfortably, she needs a substantial retirement income. She wants to receive a weekly income of $5,000 during retirement. The payments will be made at the beginning of each week during her retirement. Also, Blossom has pledged to make an annual donation to her favorite charity during her retirement. The payments will be made at the end of each year. There will be a total of 50 annual payments to the charity. The first annual payment will be for $20,000. Blossom wants the annual payments to increase by 3% per year. The payments will end when she dies. In addition, she would like to establish a scholarship at Toronto Metropolitan University. The first payment would be $80,000 and would be made 3 years after she retires. Thereafter, the scholarship payments will be made every year. She wants the payments to continue after her death, therefore…arrow_forward
- Q1: Blossom is 30 years old. She plans on retiring in 25 years, at the age of 55. She believes she will live until she is 105. In order to live comfortably, she needs a substantial retirement income. She wants to receive a weekly income of $5,000 during retirement. The payments will be made at the beginning of each week during her retirement. Also, Blossom has pledged to make an annual donation to her favorite charity during her retirement. The payments will be made at the end of each year. There will be a total of 50 annual payments to the charity. The first annual payment will be for $20,000. Blossom wants the annual payments to increase by 3% per year. The payments will end when she dies. In addition, she would like to establish a scholarship at Toronto Metropolitan University. The first payment would be $80,000 and would be made 3 years after she retires. Thereafter, the scholarship payments will be made every year. She wants the payments to continue after her death, therefore…arrow_forwardJerome Moore invests in a stock that will pay dividends of $2.00 at the end of the first year; $2.20 at the end of the second year; and $2.40 at the end of the third year. also, he believes that at the end of the third year he will be able to sell the stock for $33. what is the present value of all future benefits if a discount rate of 11 percent is applied?arrow_forwardQ1: You are an analyst in charge of valuing common stocks. You have been asked to value two stocks. The first stock NEWER Inc. just paid a dividend of $6.00. The dividend is expected to increase by 60%, 45%, 30% and 15% per year, respectively, in the next four years. Thereafter, the dividend will increase by 4% per year in perpetuity. Calculate NEWER’s expected dividend for t = 1, 2, 3, 4 and 5.The required rate of return for NEWER stock is 14% compounded annually.What is NEWER’s stock price?The second stock is OLDER Inc. OLDER Inc. will pay its first dividend of $10.00 three (3) years from today. The dividend will increase by 30% per year for the following four (4) years after its first dividend payment. Thereafter, the dividend will increase by 3% per year in perpetuity. Calculate OLDER’s expected dividend for t = 1, 2, 3, 4, 5, 6, 7 and 8.The required rate of return for OLDER stock is 16% compounded annually.What is OLDER’s stock price?Now assume that both stocks have a required…arrow_forward
- Q1: You are an analyst in charge of valuing common stocks. You have been asked to value two stocks. The first stock NEWER Inc. just paid a dividend of $6.00. The dividend is expected to increase by 60%, 45%, 30% and 15% per year, respectively, in the next four years. Thereafter, the dividend will increase by 4% per year in perpetuity. Calculate NEWER’s expected dividend for t = 1, 2, 3, 4 and 5.The required rate of return for NEWER stock is 14% compounded annually.What is NEWER’s stock price?The second stock is OLDER Inc. OLDER Inc. will pay its first dividend of $10.00 three (3) years from today. The dividend will increase by 30% per year for the following four (4) years after its first dividend payment. Thereafter, the dividend will increase by 3% per year in perpetuity. Calculate OLDER’s expected dividend for t = 1, 2, 3, 4, 5, 6, 7 and 8.The required rate of return for OLDER stock is 16% compounded annually.What is OLDER’s stock price?Now assume that both stocks have a required…arrow_forwardQ1: Blossom is 30 years old. She plans on retiring in 25 years, at the age of 55. She believes she will live until she is 105. In order to live comfortably, she needs a substantial retirement income. She wants to receive a weekly income of $5,000 during retirement. The payments will be made at the beginning of each week during her retirement. Also, Blossom has pledged to make an annual donation to her favorite charity during her retirement. The payments will be made at the end of each year. There will be a total of 50 annual payments to the charity. The first annual payment will be for $20,000. Blossom wants the annual payments to increase by 3% per year. The payments will end when she dies. In addition, she would like to establish a scholarship at Toronto Metropolitan University. The first payment would be $80,000 and would be made 3 years after she retires. Thereafter, the scholarship payments will be made every year. She wants the payments to continue after her death, therefore…arrow_forwardTrue and False 1. There are no more than two separate phases to decision making and problem solving. 2. Every manager always has complete control over all inputs and factors. 3. Opportunity cost is only considered by accountants as a way to calculate profits 4. Standard error is always used to evaluate the overall strength of the regression model 5. The t-Stat is used in a similar way as the P-valued is used 6. The P-value is used as R-square is used. 7. R-square is used to evaluate the overall strength of the model. 8. Defining the problem is one of the last things that a manager considers Interpreting Regression Printouts (very brief answers) R² = .859 Intercept T N = 51 Coefficients 13.9 F= 306.5 Standard Error .139 SER=.1036 t Stat P value 99.8 0 .275 .0157 17.5 0 The above table examines the relationship between the nunber, of poor central city households in the U.S. and changes in the costs of college tuition from 1967 to 2019. 9. What is the direction of this relationship? 10.…arrow_forward
 Essentials Of InvestmentsFinanceISBN:9781260013924Author:Bodie, Zvi, Kane, Alex, MARCUS, Alan J.Publisher:Mcgraw-hill Education,

 Foundations Of FinanceFinanceISBN:9780134897264Author:KEOWN, Arthur J., Martin, John D., PETTY, J. WilliamPublisher:Pearson,
 Fundamentals of Financial Management (MindTap Cou...FinanceISBN:9781337395250Author:Eugene F. Brigham, Joel F. HoustonPublisher:Cengage Learning
 Corporate Finance (The Mcgraw-hill/Irwin Series i...FinanceISBN:9780077861759Author:Stephen A. Ross Franco Modigliani Professor of Financial Economics Professor, Randolph W Westerfield Robert R. Dockson Deans Chair in Bus. Admin., Jeffrey Jaffe, Bradford D Jordan ProfessorPublisher:McGraw-Hill Education


