The Brazilian Amazon rain forest is the world’s largest tropical rain forest, with some of the greatest biodiversity of any region. In 2009, the number of trees cut down in the Amazon dropped to its lowest level in 20 years. The line graph shows the number of square kilometers cleared from 2001 through 2009. The data in the line graph can be modeled by the following third- and fourth-degree polynomial functions: a. Use the Leading Coefficient Test to determine the end behavior to the right for the graph of f. b. Assume that the rate at which the Amazon rain forest is being cut down continues to decline. Based on your answer to part (a), will f be useful in modeling Amazon deforestation over an extended period of time? Explain your answer. c. Use the Leading Coefficient Test to determine the end behavior to the right for the graph of g d. Assume that the rate at which the Amazon rain forest is being cut down continues to decline. Based on your answer to part (c), will g be useful in modeling Amazon deforestation over an extended period of time? Explain your answer.
The Brazilian Amazon rain forest is the world’s largest tropical rain forest, with some of the greatest biodiversity of any region. In 2009, the number of trees cut down in the Amazon dropped to its lowest level in 20 years. The line graph shows the number of square kilometers cleared from 2001 through 2009. The data in the line graph can be modeled by the following third- and fourth-degree polynomial functions: a. Use the Leading Coefficient Test to determine the end behavior to the right for the graph of f. b. Assume that the rate at which the Amazon rain forest is being cut down continues to decline. Based on your answer to part (a), will f be useful in modeling Amazon deforestation over an extended period of time? Explain your answer. c. Use the Leading Coefficient Test to determine the end behavior to the right for the graph of g d. Assume that the rate at which the Amazon rain forest is being cut down continues to decline. Based on your answer to part (c), will g be useful in modeling Amazon deforestation over an extended period of time? Explain your answer.
Solution Summary: The author analyzes whether the provided polynomial function f(x) is useful in modeling Amazon deforestation over an extended period of time.
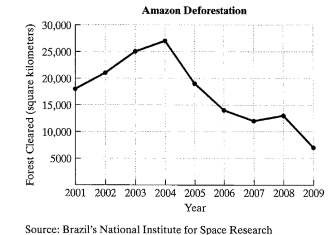
The Brazilian Amazon rain forest is the world’s largest tropical rain forest, with some of the greatest biodiversity of any region. In 2009, the number of trees cut down in the Amazon dropped to its lowest level in 20 years. The line graph shows the number of square kilometers cleared from 2001 through 2009.
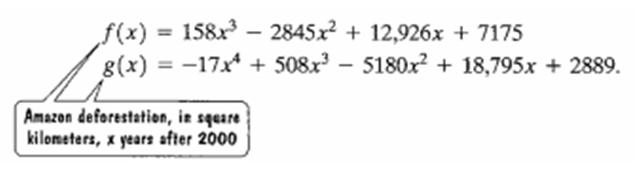
The data in the line graph can be modeled by the following third- and fourth-degree polynomial functions:
a. Use the Leading Coefficient Test to determine the end behavior to the right for the graph of f.
b. Assume that the rate at which the Amazon rain forest is being cut down continues to decline. Based on your answer to part (a), will f be useful in modeling Amazon deforestation over an extended period of time? Explain your answer.
c. Use the Leading Coefficient Test to determine the end behavior to the right for the graph of g
d. Assume that the rate at which the Amazon rain forest is being cut down continues to decline. Based on your answer to part (c), will g be useful in modeling Amazon deforestation over an extended period of time? Explain your answer.
Solve the equation. Write the smaller
answer first.
2
(x-6)²
= 36
x =
Α
x =
Previous Page
Next Page
Write a quadratic equation in
factored form that has solutions of x
=
2 and x = = -3/5
○ a) (x-2)(5x + 3) = 0
○ b) (x + 2)(3x-5) = 0
O
c) (x + 2)(5x -3) = 0
○ d) (x-2)(3x + 5) = 0
Need a deep-dive on the concept behind this application? Look no further. Learn more about this topic, algebra and related others by exploring similar questions and additional content below.


 Algebra & Trigonometry with Analytic GeometryAlgebraISBN:9781133382119Author:SwokowskiPublisher:Cengage
 Algebra: Structure And Method, Book 1AlgebraISBN:9780395977224Author:Richard G. Brown, Mary P. Dolciani, Robert H. Sorgenfrey, William L. ColePublisher:McDougal Littell
 Elementary AlgebraAlgebraISBN:9780998625713Author:Lynn Marecek, MaryAnne Anthony-SmithPublisher:OpenStax - Rice University
 Glencoe Algebra 1, Student Edition, 9780079039897...AlgebraISBN:9780079039897Author:CarterPublisher:McGraw Hill