
Concept explainers
Videos
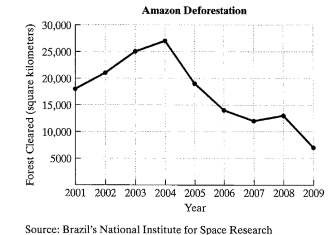
The Brazilian Amazon rain forest is the world’s largest tropical rain forest, with some of the greatest biodiversity of any region. In 2009, the number of trees cut down in the Amazon dropped to its lowest level in 20 years. The line graph shows the number of square kilometers cleared from 2001 through 2009.
The data in the line graph can be modeled by the following third- and fourth-degree polynomial functions:
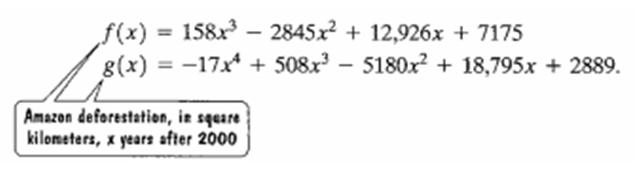
a. Use the Leading Coefficient Test to determine the end behavior to the right for the graph of f.
b. Assume that the rate at which the Amazon rain forest is being cut down continues to decline. Based on your answer to part (a), will f be useful in modeling Amazon deforestation over an extended period of time? Explain your answer.
c. Use the Leading Coefficient Test to determine the end behavior to the right for the graph of g
d. Assume that the rate at which the Amazon rain forest is being cut down continues to decline. Based on your answer to part (c), will g be useful in modeling Amazon deforestation over an extended period of time? Explain your answer.
Want to see the full answer?
Check out a sample textbook solution
Chapter 3 Solutions
Algebra and Trigonometry


- 3. Let 4 0 0 00 0 0 1.2 0 00 0 0 0 -10.1 0 0 0 D = 0 0 0 00 0 0 0 0 05 0 0 0 0 0 0 2.8 Either explicitly compute D-¹ or explain why it doesn't exist.arrow_forward4. [9 points] Assume that B, C, E are all 3 x 3 matrices such that BC == -64 -1 0 3 4 4 4 -2 2 CB=-1-2 4 BE -2 1 3 EC = 1 3 2 -7, 1 6 -6 2-5 -7 -2 Explicitly compute the following by hand. (I.e., write out the entries of the 3 × 3 matrix.) (a) [3 points] B(E+C) (b) [3 points] (E+B)C (c) [3 points] ETBTarrow_forward6. Consider the matrices G = 0 (3) -3\ -3 2 and H = -1 2 0 5 0 5 5 noting that H(:, 3) = 2H(:,1) + H(:, 2). Is G invertible? Explain your answer. Is H invertible? Explain your answer. Use co-factor expansion to find the determinant of H. (Hint: expand the 2nd or 3rd row)arrow_forward
- For the matrix A = = ( 6 }) . explicitly compute by hand (with work shown) the following. I2A, where I2 is the 2 × 2 identity matrix. A-1 solving the following linear systems by using A-¹: c+y= 1 y = 1 (d) (e) (f) A² find the diagonal entries of Aarrow_forwardIf 3x−y=12, what is the value of 8x / 2y A) 212B) 44C) 82D) The value cannot be determined from the information given.arrow_forwardC=59(F−32) The equation above shows how temperature F, measured in degrees Fahrenheit, relates to a temperature C, measured in degrees Celsius. Based on the equation, which of the following must be true? A temperature increase of 1 degree Fahrenheit is equivalent to a temperature increase of 59 degree Celsius. A temperature increase of 1 degree Celsius is equivalent to a temperature increase of 1.8 degrees Fahrenheit. A temperature increase of 59 degree Fahrenheit is equivalent to a temperature increase of 1 degree Celsius. A) I onlyB) II onlyC) III onlyD) I and II onlyarrow_forward
- (1) Let F be a field, show that the vector space F,NEZ* be a finite dimension. (2) Let P2(x) be the vector space of polynomial of degree equal or less than two and M={a+bx+cx²/a,b,cЄ R,a+b=c),show that whether Mis hyperspace or not. (3) Let A and B be a subset of a vector space such that ACB, show that whether: (a) if A is convex then B is convex or not. (b) if B is convex then A is convex or not. (4) Let R be a field of real numbers and X=R, X is a vector space over R show that by definition the norms/II.II, and II.112 on X are equivalent where Ilxll₁ = max(lx,l, i=1,2,...,n) and llxll₂=(x²). oper (5) Let Ⓡ be a field of real numbers, Ⓡis a normed space under usual operations and norm, let E=(2,5,8), find int(E), b(E) and D(E). (6) Write the definition of bounded linear function between two normed spaces and write with prove the relation between continuous and bounded linear function between two normed spaces.arrow_forwardind → 6 Q₁/(a) Let R be a field of real numbers and X-P(x)=(a+bx+cx²+dx/ a,b,c,dER},X is a vector space over R, show that is finite dimension. (b) Let be a bijective linear function from a finite dimension vector ✓ into a space Yand Sbe a basis for X, show that whether f(S) basis for or not. (c) Let be a vector space over a field F and A,B)affine subsets of X,show that whether aAn BB, aAU BB be affine subsets of X or not, a,ẞ EF. (12 Jal (answer only two) (6) Let M be a non-empty subset of a vector space X and tEX, show that M is a hyperspace of X iff t+M is a hyperplane of X and tЄt+M. (b) State Jahn-Banach theorem and write with prove an application of Hahn-arrow_forward(b) Let A and B be two subset of a linear space X such that ACB, show that whether if A is affine set then B affine or need not and if B affine set then A affine set or need not. Qz/antonly be a-Show that every hyperspace of a vecor space X is hyperplane but the convers need not to be true. b- Let M be a finite dimension subspace of a Banach space X show that M is closed set. c-Show that every two norms on finite dimension vector space are equivant (1) Q/answer only two a-Write the definition of bounded set in: a normed space and write with prove an equivalent statement to a definition. b- Let f be a function from a normed space X into a normed space Y, show that f continuous iff f is bounded. c-Show that every finite dimension normed space is a Banach. Q/a- Let A and B two open sets in a normed space X, show that by definition AnB and AUB are open sets. (1 nood truearrow_forward
- log (6x+5)-log 3 = log 2 - log xarrow_forward1 The ratio of Argan to Potassium from a sample found sample found in Canada is .195 Find The estimated age of the sample A In (1+8.33 (+)) t = (1-26 × 109) en (1 In aarrow_forward7. Find the doubling time of an investment earning 2.5% interest compounded a) semiannually b) continuouslyarrow_forward
 Algebra & Trigonometry with Analytic GeometryAlgebraISBN:9781133382119Author:SwokowskiPublisher:Cengage
 Algebra: Structure And Method, Book 1AlgebraISBN:9780395977224Author:Richard G. Brown, Mary P. Dolciani, Robert H. Sorgenfrey, William L. ColePublisher:McDougal Littell
 Elementary AlgebraAlgebraISBN:9780998625713Author:Lynn Marecek, MaryAnne Anthony-SmithPublisher:OpenStax - Rice University
 Glencoe Algebra 1, Student Edition, 9780079039897...AlgebraISBN:9780079039897Author:CarterPublisher:McGraw Hill