
Concept explainers
Videos
(a)
Section 1:
To find: The 20 simple random samples of size 5 and record the number of instate students in each sample.
(a)
Section 1:
Answer to Problem 14E
Solution: The partial output of 20 simple random samples is shown below:
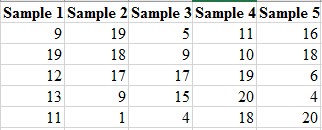
The number of instate players obtained in each set of samples is shown in the below table.
| Samples | Number of instate players | Samples | Number of instate players |
| Sample 1 | 2 | Sample 11 | 4 |
| Sample 2 | 1 | Sample 12 | 1 |
| Sample 3 | 2 | Sample 13 | 3 |
| Sample 4 | 2 | Sample 14 | 0 |
| Sample 5 | 1 | Sample 15 | 2 |
| Sample 6 | 0 | Sample 16 | 0 |
| Sample 7 | 3 | Sample 17 | 3 |
| Sample 8 | 3 | Sample 18 | 2 |
| Sample 9 | 1 | Sample 19 | 3 |
| Sample 10 | 4 | Sample 20 | 3 |
Explanation of Solution
Calculation:
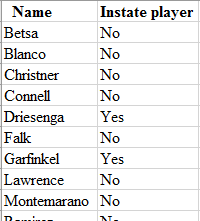
Step 1: In the Excel spreadsheet, write the name of the students and whether they are instate players or not. The snapshot is shown below:
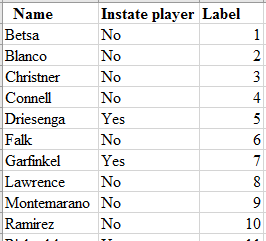
Step 2: Label each of the students using the numbers
Step 3: Use the formula

To find the number of instate players in each sample, the label of each instate players are matched with the obtained random number of each set of sample and calculate the number of instate players. The number of instate players obtained in each set of samples are shown in the below table.
| Samples | Number of instate players | Samples | Number of instate players |
| Sample 1 | 2 | Sample 11 | 4 |
| Sample 2 | 1 | Sample 12 | 1 |
| Sample 3 | 2 | Sample 13 | 3 |
| Sample 4 | 2 | Sample 14 | 0 |
| Sample 5 | 1 | Sample 15 | 2 |
| Sample 6 | 0 | Sample 16 | 0 |
| Sample 7 | 3 | Sample 17 | 3 |
| Sample 8 | 3 | Sample 18 | 2 |
| Sample 9 | 1 | Sample 19 | 3 |
| Sample 10 | 4 | Sample 20 | 3 |
Section 2:
To graph: The histogram for the number of instate players in each set of sample.
Section 2:
Answer to Problem 14E
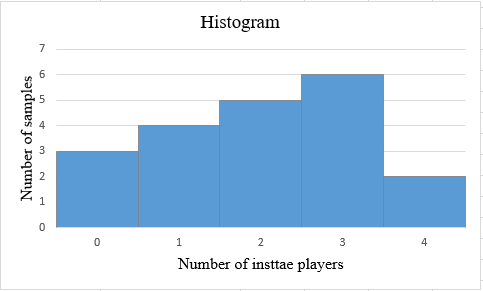
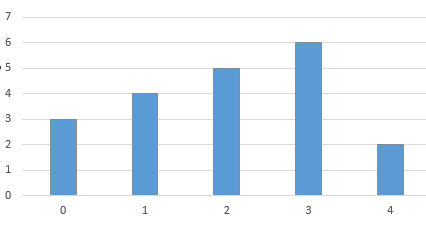
Solution: The obtained histogram is obtained as:
Explanation of Solution
Graph:
To obtain the histogram for the obtained result in previous part, Excel is used. The below steps are followed to obtained the required histogram.
Step 1: The number of instate players varies from 0 to 4. The number of samples are calculated corresponding to each number of instate players. The number of samples with same number of instate players are clustered. The snapshot of the obtained table is shown below:
| Number of instate players members | Number of samples |
| 0 | 3 |
| 1 | 4 |
| 2 | 5 |
| 3 | 6 |
| 4 | 2 |
Step 2: Select the data set and go to insert and select the option of cluster column under the Recommended Charts. The screenshot is shown below:
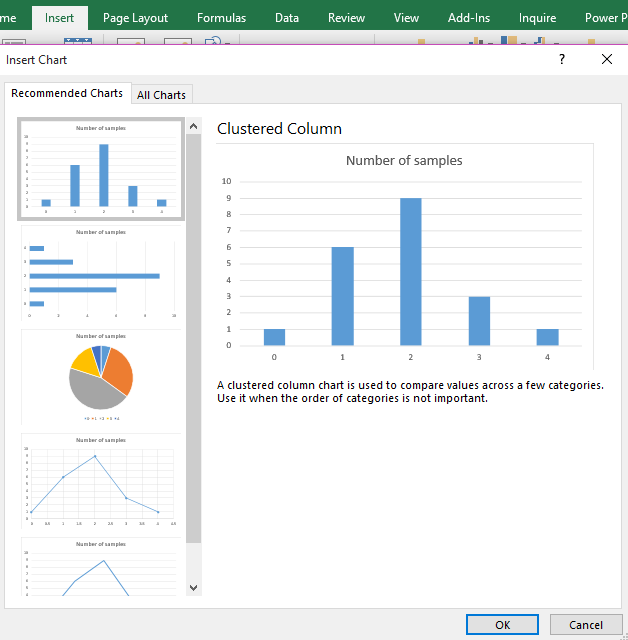
Step 3: Click on OK. The diagram is obtained as:
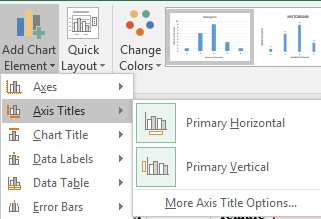
Step 4: Click on the chart area and select the option of “Primary Horizontal” and “Primary Vertical” axis under the “Add Chart Element” to add the axis title. The screenshot is shown below:
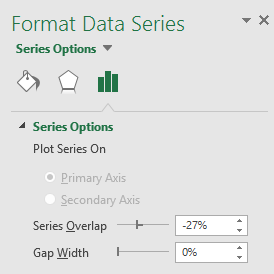
Step 5: Click on the bars of the diagrams and reduce the gap width to zero under the “Format Data Series” tab. The screenshot is shown below:
The obtained histogram is:

Section 3:
To find: The average number of instate players in 20 samples.
Section 3:
Answer to Problem 14E
Solution: The average number of instate players is 2.
Explanation of Solution
Explanation
Calculation:
The average number of instate players can be obtained by using the formula:
Hence, the average number of instate players is calculated as:
(b)
To explain: Whether the college should be doubtful about the discrimination if any of the five scholarships does not received by instate players.
(b)
Answer to Problem 14E
Solution: The college should suspect the discrimination if any of the five scholarships does not received by instate players.
Explanation of Solution
Want to see more full solutions like this?
Chapter 3 Solutions
Launchpad For Moore's Statistics: Concepts And Controversies (twelve Month Access)


- QUAI6221wA1.docx X + int.com/:w:/r/sites/TertiaryStudents/_layouts/15/Doc.aspx?sourcedoc=%7B2759DFAB-EA5E-4526-9991-9087A973B894%7 26 QUAT6221wA1 Q.1.1.8 One advantage of primary data is that: (1) It is low quality (2) It is irrelevant to the purpose at hand (3) It is time-consuming to collect (4) None of the other options Accessibility Mode Immersive R Q.1.1.9 A sample of fifteen apples is selected from an orchard. We would refer to one of these apples as: (2) ھا (1) A parameter (2) A descriptive statistic (3) A statistical model A sampling unit Q.1.1.10 Categorical data, where the categories do not have implied ranking, is referred to as: (2) Search D (2) 1+ PrtSc Insert Delete F8 F10 F11 F12 Backspace 10 ENG USarrow_forwardepoint.com/:w:/r/sites/TertiaryStudents/_layouts/15/Doc.aspx?sourcedoc=%7B2759DFAB-EA5E-4526-9991-9087A 23;24; 25 R QUAT6221WA1 Accessibility Mode DE 2025 Q.1.1.4 Data obtained from outside an organisation is referred to as: (2) 45 (1) Outside data (2) External data (3) Primary data (4) Secondary data Q.1.1.5 Amongst other disadvantages, which type of data may not be problem-specific and/or may be out of date? W (2) E (1) Ordinal scaled data (2) Ratio scaled data (3) Quantitative, continuous data (4) None of the other options Search F8 F10 PrtSc Insert F11 F12 0 + /1 Backspaarrow_forward/r/sites/TertiaryStudents/_layouts/15/Doc.aspx?sourcedoc=%7B2759DFAB-EA5E-4526-9991-9087A973B894%7D&file=Qu Q.1.1.14 QUAT6221wA1 Accessibility Mode Immersive Reader You are the CFO of a company listed on the Johannesburg Stock Exchange. The annual financial statements published by your company would be viewed by yourself as: (1) External data (2) Internal data (3) Nominal data (4) Secondary data Q.1.1.15 Data relevancy refers to the fact that data selected for analysis must be: (2) Q Search (1) Checked for errors and outliers (2) Obtained online (3) Problem specific (4) Obtained using algorithms U E (2) 100% 高 W ENG A US F10 点 F11 社 F12 PrtSc 11 + Insert Delete Backspacearrow_forward
- A client of a commercial rose grower has been keeping records on the shelf-life of a rose. The client sent the following frequency distribution to the grower. Rose Shelf-Life Days of Shelf-Life Frequency fi 1-5 2 6-10 4 11-15 7 16-20 6 21-25 26-30 5 2 Step 2 of 2: Calculate the population standard deviation for the shelf-life. Round your answer to two decimal places, if necessary.arrow_forwardA market research firm used a sample of individuals to rate the purchase potential of a particular product before and after the individuals saw a new television commercial about the product. The purchase potential ratings were based on a 0 to 10 scale, with higher values indicating a higher purchase potential. The null hypothesis stated that the mean rating "after" would be less than or equal to the mean rating "before." Rejection of this hypothesis would show that the commercial improved the mean purchase potential rating. Use = .05 and the following data to test the hypothesis and comment on the value of the commercial. Purchase Rating Purchase Rating Individual After Before Individual After Before 1 6 5 5 3 5 2 6 4 6 9 8 3 7 7 7 7 5 4 4 3 8 6 6 What are the hypotheses?H0: d Ha: d Compute (to 3 decimals).Compute sd (to 1 decimal). What is the p-value?The p-value is What is your decision?arrow_forwardWhy would you use a histograph or bar graph? Which would be better and why for the data shown.arrow_forward
- Please help me with this question on statisticsarrow_forwardPlease help me with this statistics questionarrow_forwardPlease help me with the following statistics questionFor question (e), the options are:Assuming that the null hypothesis is (false/true), the probability of (other populations of 150/other samples of 150/equal to/more data/greater than) will result in (stronger evidence against the null hypothesis than the current data/stronger evidence in support of the null hypothesis than the current data/rejecting the null hypothesis/failing to reject the null hypothesis) is __.arrow_forward
- Please help me with the following question on statisticsFor question (e), the drop down options are: (From this data/The census/From this population of data), one can infer that the mean/average octane rating is (less than/equal to/greater than) __. (use one decimal in your answer).arrow_forwardHelp me on the following question on statisticsarrow_forward3. [15] The joint PDF of RVS X and Y is given by fx.x(x,y) = { x) = { c(x + { c(x+y³), 0, 0≤x≤ 1,0≤ y ≤1 otherwise where c is a constant. (a) Find the value of c. (b) Find P(0 ≤ X ≤,arrow_forwardarrow_back_iosSEE MORE QUESTIONSarrow_forward_ios
 MATLAB: An Introduction with ApplicationsStatisticsISBN:9781119256830Author:Amos GilatPublisher:John Wiley & Sons Inc
 Probability and Statistics for Engineering and th...StatisticsISBN:9781305251809Author:Jay L. DevorePublisher:Cengage Learning
 Statistics for The Behavioral Sciences (MindTap C...StatisticsISBN:9781305504912Author:Frederick J Gravetter, Larry B. WallnauPublisher:Cengage Learning
 Elementary Statistics: Picturing the World (7th E...StatisticsISBN:9780134683416Author:Ron Larson, Betsy FarberPublisher:PEARSON
 The Basic Practice of StatisticsStatisticsISBN:9781319042578Author:David S. Moore, William I. Notz, Michael A. FlignerPublisher:W. H. Freeman
 Introduction to the Practice of StatisticsStatisticsISBN:9781319013387Author:David S. Moore, George P. McCabe, Bruce A. CraigPublisher:W. H. Freeman