
Videos
(a)
To find: The people who are selected for the simple random sample.
(a)
Answer to Problem 12E
Solution: The selected people are those who are labeled as 19, 22, 39, and 50.
Explanation of Solution
Calculation:
The people are labeled as
The people selected are the people who are numbered with the same number of the selected random numbers.
To find: The proportion,
Answer to Problem 12E
Solution: The required proportion is obtained as 0.5.
Explanation of Solution
Calculation:
According to the question, the colored circle indicates the persons who are opposing the constitutional amendment and the white circle represents the people who are in favor of the amendment. The selected persons are 19, 22, 39, and 50. Among them, 19 and 50 are the colored circles and 22 and 39 are the white circles.
Therefore, the proportion
(b)
To find: The people who are selected for the simple random sample.
(b)
Answer to Problem 12E
Solution: The selected people are those people who are labeled with the same number of selected random number and the samples are shown in the below table.
| Sample | Selected label |
| Sample 1 | 45, 46, 77, 17 |
| Sample 2 | 52, 71, 13, 88 |
| Sample 3 | 95, 59, 29, 40 |
| Sample 4 | 68, 41, 73, 50 |
| Sample 5 | 82, 73, 95, 78 |
| Sample 6 | 60, 94, 07, 20 |
| Sample 7 | 36, 00, 91, 93 |
| Sample 8 | 38, 44,84, 87 |
| Sample 9 | 73, 67, 64, 71 |
Explanation of Solution
Calculation:
The people are labeled as
The people selected are the people who are numbered with the same number of the selected random numbers.
Similarly, the other eight samples of size 4 are selected and the samples are shown in the below table.
| Sample | Selected label |
| Sample 1 | 45, 46, 77, 17 |
| Sample 2 | 52, 71, 13, 88 |
| Sample 3 | 95, 59, 29, 40 |
| Sample 4 | 68, 41, 73, 50 |
| Sample 5 | 82, 73, 95, 78 |
| Sample 6 | 60, 94, 07, 20 |
| Sample 7 | 36, 00, 91, 93 |
| Sample 8 | 38, 44, 84, 87 |
Here, the people selected in each set of sample are the people who are numbered with the same number of the selected random numbers.
To find: The proportion,
Answer to Problem 12E
Solution: The required proportions for the 10 samples are shown below.
| Sample | Labeled value | Proportion |
| Sample 1 | 45, 46, 77, 17 | 0.75 |
| Sample 2 | 52, 71, 13, 88 | 1 |
| Sample 3 | 95, 59, 29, 40 | 0.75 |
| Sample 4 | 68, 41, 73, 50 | 0.5 |
| Sample 5 | 82, 73, 95, 78 | 0.75 |
| Sample 6 | 60, 94, 07, 20 | 0 |
| Sample 7 | 36, 00, 91, 93 | 0.75 |
| Sample 8 | 38, 44,84, 87 | 0.5 |
| Sample 9 | 73, 67, 64, 71 | 0.5 |
| Sample 10 | 19, 22, 39, 50 | 0.5 |
Explanation of Solution
Calculation:
The calculation of the sample proportion,
| Sample | Labeled value | Colored circle | White circle | Proportion |
| Sample 1 | 45, 46, 77, 17 | 77 | 45, 46, 17 | |
| Sample 2 | 52, 71, 13, 88 | 88 | 52, 71, 13 | |
| Sample 3 | 95, 59, 29, 40 | 29, 40, 95, 59 | ||
| Sample 4 | 68, 41, 73, 50 | 73, 50 | 68, 41 | |
| Sample 5 | 82, 73, 95, 78 | 73, | 82, 95, 78 | |
| Sample 6 | 60, 94, 07, 20 | 60, 94, 07, 20 | ||
| Sample 7 | 36, 00, 91, 93 | 91 | 00, 36, 93 | |
| Sample 8 | 38, 44,84, 87 | 38, 87 | 44, 84 | |
| Sample 9 | 73, 67, 64, 71 | 73, 64 | 67, 71 | |
| Sample 10 | 19, 22, 39, 50 | 22, 39 | 19, 50 |
(c)
To graph: The histogram.
(c)
Answer to Problem 12E
Solution: The required histogram is shown below.
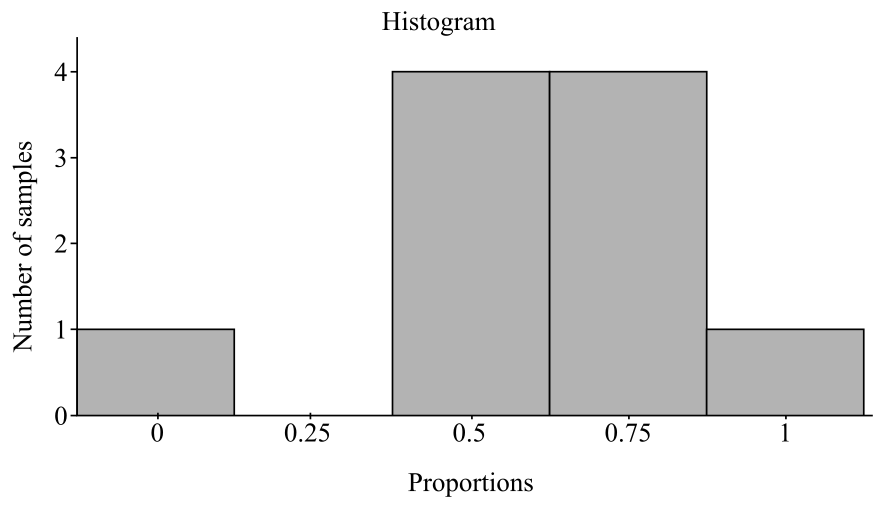
Explanation of Solution

Interpretation: From the hisogram it is clear that none of the sample has sample proportion of 0.25.
(d)
The number of sample proportion that estimates the population proportion as p = 0.5
(d)
Answer to Problem 12E
Solution: There are 4 samples that provide the proportion as 0.5.
Explanation of Solution
Whether the value 0.5 is in the center of the sample values.
Answer to Problem 12E
Solution: The original value 0.5 is in the center for the sample proportion values.
Explanation of Solution
To explain: The reason that the population proportion value will be in the center for the large samples.
Answer to Problem 12E
Solution: The value will be centered in 0.5 for large samples because the large samples have less variability than the small samples.
Explanation of Solution
Want to see more full solutions like this?
Chapter 3 Solutions
Launchpad For Moore's Statistics: Concepts And Controversies (twelve Month Access)


- QUAI6221wA1.docx X + int.com/:w:/r/sites/TertiaryStudents/_layouts/15/Doc.aspx?sourcedoc=%7B2759DFAB-EA5E-4526-9991-9087A973B894%7 26 QUAT6221wA1 Q.1.1.8 One advantage of primary data is that: (1) It is low quality (2) It is irrelevant to the purpose at hand (3) It is time-consuming to collect (4) None of the other options Accessibility Mode Immersive R Q.1.1.9 A sample of fifteen apples is selected from an orchard. We would refer to one of these apples as: (2) ھا (1) A parameter (2) A descriptive statistic (3) A statistical model A sampling unit Q.1.1.10 Categorical data, where the categories do not have implied ranking, is referred to as: (2) Search D (2) 1+ PrtSc Insert Delete F8 F10 F11 F12 Backspace 10 ENG USarrow_forwardepoint.com/:w:/r/sites/TertiaryStudents/_layouts/15/Doc.aspx?sourcedoc=%7B2759DFAB-EA5E-4526-9991-9087A 23;24; 25 R QUAT6221WA1 Accessibility Mode DE 2025 Q.1.1.4 Data obtained from outside an organisation is referred to as: (2) 45 (1) Outside data (2) External data (3) Primary data (4) Secondary data Q.1.1.5 Amongst other disadvantages, which type of data may not be problem-specific and/or may be out of date? W (2) E (1) Ordinal scaled data (2) Ratio scaled data (3) Quantitative, continuous data (4) None of the other options Search F8 F10 PrtSc Insert F11 F12 0 + /1 Backspaarrow_forward/r/sites/TertiaryStudents/_layouts/15/Doc.aspx?sourcedoc=%7B2759DFAB-EA5E-4526-9991-9087A973B894%7D&file=Qu Q.1.1.14 QUAT6221wA1 Accessibility Mode Immersive Reader You are the CFO of a company listed on the Johannesburg Stock Exchange. The annual financial statements published by your company would be viewed by yourself as: (1) External data (2) Internal data (3) Nominal data (4) Secondary data Q.1.1.15 Data relevancy refers to the fact that data selected for analysis must be: (2) Q Search (1) Checked for errors and outliers (2) Obtained online (3) Problem specific (4) Obtained using algorithms U E (2) 100% 高 W ENG A US F10 点 F11 社 F12 PrtSc 11 + Insert Delete Backspacearrow_forward
- A client of a commercial rose grower has been keeping records on the shelf-life of a rose. The client sent the following frequency distribution to the grower. Rose Shelf-Life Days of Shelf-Life Frequency fi 1-5 2 6-10 4 11-15 7 16-20 6 21-25 26-30 5 2 Step 2 of 2: Calculate the population standard deviation for the shelf-life. Round your answer to two decimal places, if necessary.arrow_forwardA market research firm used a sample of individuals to rate the purchase potential of a particular product before and after the individuals saw a new television commercial about the product. The purchase potential ratings were based on a 0 to 10 scale, with higher values indicating a higher purchase potential. The null hypothesis stated that the mean rating "after" would be less than or equal to the mean rating "before." Rejection of this hypothesis would show that the commercial improved the mean purchase potential rating. Use = .05 and the following data to test the hypothesis and comment on the value of the commercial. Purchase Rating Purchase Rating Individual After Before Individual After Before 1 6 5 5 3 5 2 6 4 6 9 8 3 7 7 7 7 5 4 4 3 8 6 6 What are the hypotheses?H0: d Ha: d Compute (to 3 decimals).Compute sd (to 1 decimal). What is the p-value?The p-value is What is your decision?arrow_forwardWhy would you use a histograph or bar graph? Which would be better and why for the data shown.arrow_forward
- Please help me with this question on statisticsarrow_forwardPlease help me with this statistics questionarrow_forwardPlease help me with the following statistics questionFor question (e), the options are:Assuming that the null hypothesis is (false/true), the probability of (other populations of 150/other samples of 150/equal to/more data/greater than) will result in (stronger evidence against the null hypothesis than the current data/stronger evidence in support of the null hypothesis than the current data/rejecting the null hypothesis/failing to reject the null hypothesis) is __.arrow_forward
- Please help me with the following question on statisticsFor question (e), the drop down options are: (From this data/The census/From this population of data), one can infer that the mean/average octane rating is (less than/equal to/greater than) __. (use one decimal in your answer).arrow_forwardHelp me on the following question on statisticsarrow_forward3. [15] The joint PDF of RVS X and Y is given by fx.x(x,y) = { x) = { c(x + { c(x+y³), 0, 0≤x≤ 1,0≤ y ≤1 otherwise where c is a constant. (a) Find the value of c. (b) Find P(0 ≤ X ≤,arrow_forwardarrow_back_iosSEE MORE QUESTIONSarrow_forward_ios
 MATLAB: An Introduction with ApplicationsStatisticsISBN:9781119256830Author:Amos GilatPublisher:John Wiley & Sons Inc
 Probability and Statistics for Engineering and th...StatisticsISBN:9781305251809Author:Jay L. DevorePublisher:Cengage Learning
 Statistics for The Behavioral Sciences (MindTap C...StatisticsISBN:9781305504912Author:Frederick J Gravetter, Larry B. WallnauPublisher:Cengage Learning
 Elementary Statistics: Picturing the World (7th E...StatisticsISBN:9780134683416Author:Ron Larson, Betsy FarberPublisher:PEARSON
 The Basic Practice of StatisticsStatisticsISBN:9781319042578Author:David S. Moore, William I. Notz, Michael A. FlignerPublisher:W. H. Freeman
 Introduction to the Practice of StatisticsStatisticsISBN:9781319013387Author:David S. Moore, George P. McCabe, Bruce A. CraigPublisher:W. H. Freeman