EBK BUSINESS ANALYTICS
3rd Edition
ISBN: 9780135231906
Author: Evans
Publisher: VST
expand_more
expand_more
format_list_bulleted
Concept explainers
Videos
Textbook Question
Chapter 3, Problem 13PE
A marketing researcher surveyed
The following results are shown:
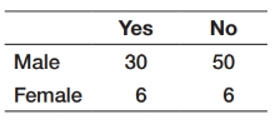
Convert the data into percentages for each gender class. Then construct a chart of the counts and a chart of the percentages. Discuss what each conveys visually and how the different charts may lead to different interpretations of the data.
Expert Solution & Answer
Want to see the full answer?
Check out a sample textbook solution
Students have asked these similar questions
Goodwill is an example of an indefinite-life intangible asset, meaning that public companies must test it for impairment rather than regularly amortizing to systematically reduce its value on the balance sheet of the public company.
Can anyone recap the difference between limited-life versus indefinite-life intangible assets? Any specific examples of either category?
Why are adjusting journal entries necessary at the end of an accounting period? Need he
Difference-in-Difference
In the beginning of 2001, North Dakota legalized fireworks. Suppose you are interested in
studying the effect of the legalizing of fireworks on the number of house fires in North
Dakota. Unlike North Dakota, South Dakota did not legalize fireworks and continued to ban
them. You decide to use a Difference-in-difference (DID) Model. The numbers of house fires
in each state at the end of 2000 and 2001 are as follows:
Number of house fires in Number of house fires in
Year
North Dakota
2000
2001
35
50
South Dakota
54
64
a. What is the change in the outcome for the treatment group between 2000 and 2001?
Show your working for full credit. (10 points)
b. Can we interpret the change in the outcome for the treatment group between 2000
and 2001 as the causal effect of legalizing fireworks on number of house fires?
Explain your answer. (10 points)
Chapter 3 Solutions
EBK BUSINESS ANALYTICS
Ch. 3 - Prob. 2PECh. 3 - Create a line chart for the closing prices for all...Ch. 3 - Create a pie chart showing the breakdown of...Ch. 3 - Create a stacked area chart contrasting primary...Ch. 3 - A national homebuilder builds single-family homes...Ch. 3 - The Excel file Facebook Survey provides data...Ch. 3 - Create a bubble chart for the first five colleges...Ch. 3 - Construct a column chart for the data in the Excel...Ch. 3 - The Excel file Internet Usage provides data about...Ch. 3 - Construct an appropriate chart to show the...
Ch. 3 - A marketing researcher surveyed 92 individuals,...Ch. 3 - In the Excel file Banking Data, apply the...Ch. 3 - Apply three different colors of data bars to...Ch. 3 - For the Store and Regional Sales database, apply a...Ch. 3 - For the Excel file Closing Stock Prices, apply...Ch. 3 - Create a useful dashboard for the data in the...Ch. 3 - Create a useful dashboard for the data in the...Ch. 3 - Create a useful dashboard for the data in the...
Knowledge Booster


Learn more about
Need a deep-dive on the concept behind this application? Look no further. Learn more about this topic, subject and related others by exploring similar questions and additional content below.Similar questions
- C. Regression Discontinuity Birth weight is used as a common sign for a newborn's health. In the United States, if a baby has a birthweight below 1500 grams, the newborn is classified as having “very low birth weight". Suppose you want to study the effect of having very low birth weight on the number of hospital visits made before the baby's first birthday. You decide to use Regression Discontinuity to answer this question. The graph below shows the RD model: Number of hospital visits made before baby's first birthday 5 1400 1450 1500 1550 1600 Birthweight (in grams) a. What is the running variable? (5 points) b. What is the cutoff? (5 points) T What is the discontinuity in the graph and how do you interpret it? (10 points)arrow_forwardWhy are adjusting journal entries necessary at the end of an accounting period?i need helparrow_forwardC. Regression Discontinuity Birth weight is used as a common sign for a newborn's health. In the United States, if a baby has a birthweight below 1500 grams, the newborn is classified as having “very low birth weight". Suppose you want to study the effect of having very low birth weight on the number of hospital visits made before the baby's first birthday. You decide to use Regression Discontinuity to answer this question. The graph below shows the RD model: Number of hospital visits made before baby's first birthday 5 1400 1450 1500 1550 1600 Birthweight (in grams) a. What is the running variable? (5 points) b. What is the cutoff? (5 points) T What is the discontinuity in the graph and how do you interpret it? (10 points)arrow_forward
- Experiments Research suggests that if students use laptops in class, it can have some effect on student achievement. While laptop usage can help students take lecture notes faster, some argue that the laptops may be a source of distraction for the students. Suppose you are interested in looking at the effect of using laptops in class on the students' final exam scores out of 100. You decide to conduct a randomized control trial where you randomly assign some students at UIC to use a laptop in class and other to not use a laptop in class. (Assume that the classes are in person and not online) a. Which people are a part of the treatment group and which people are a part of the control group? (10 points) b. What regression will you run? Define the variables where required. (10 points)arrow_forwardWhy are adjusting journal entries necessary at the end of an accounting period?arrow_forwardExperiments Research suggests that if students use laptops in class, it can have some effect on student achievement. While laptop usage can help students take lecture notes faster, some argue that the laptops may be a source of distraction for the students. Suppose you are interested in looking at the effect of using laptops in class on the students' final exam scores out of 100. You decide to conduct a randomized control trial where you randomly assign some students at UIC to use a laptop in class and other to not use a laptop in class. (Assume that the classes are in person and not online) a. Which people are a part of the treatment group and which people are a part of the control group? (10 points) b. What regression will you run? Define the variables where required. (10 points)arrow_forward
- How do you distinguish between capital expenditures and revenue expenditures? no aiarrow_forwardDummy variables News reports claim that in the last year television watching has increased. You believe that rising unemployment during Covid may be one of the causes for this. Suppose you are interested in looking at the effect of being unemployed on the hours spent watching Netflix per day. You collect data on 10,000 people from Chicago who are between the age of 20 and 60. You define the dummy variable Unemployed which takes the value 1 for those who are unemployed and 0 for those who are employed. Equation 1: Hours spent watching Netflix₁ = ßo + B₁Unemployed; + ε¿ Following is the output for equation 1: reg hours spent_watching_netflix unemployed Source SS df MS Number of obs 10,000 F(1, 9998) = 14314.03 Model Residual 3539.70065 2472.39364 9,998 1 3539.70065 .247288822 Prob F R-squared == 0.0000 = 0.5888 Total 6012.09429 9,999 . 601269556 Adj R-squared Root MSE = 0.5887 .49728 hours spen~x Coef. Std. Err. t P>|t| [95% Conf. Interval] unemployed cons 1.189908 .0099456 119.64…arrow_forwardHow do you distinguish between capital expenditures and revenue expenditures? need helparrow_forward
- Dummy variables News reports claim that in the last year television watching has increased. You believe that rising unemployment during Covid may be one of the causes for this. Suppose you are interested in looking at the effect of being unemployed on the hours spent watching Netflix per day. You collect data on 10,000 people from Chicago who are between the age of 20 and 60. You define the dummy variable Unemployed which takes the value 1 for those who are unemployed and 0 for those who are employed. Equation 1: Hours spent watching Netflix₁ = ßo + B₁Unemployed; + ε¿ Following is the output for equation 1: reg hours spent_watching_netflix unemployed Source SS df MS Number of obs 10,000 F(1, 9998) = 14314.03 Model Residual 3539.70065 2472.39364 9,998 1 3539.70065 .247288822 Prob F R-squared == 0.0000 = 0.5888 Total 6012.09429 9,999 . 601269556 Adj R-squared Root MSE = 0.5887 .49728 hours spen~x Coef. Std. Err. t P>|t| [95% Conf. Interval] unemployed cons 1.189908 .0099456 119.64…arrow_forwardHow do you distinguish between capital expenditures and revenue expenditures?arrow_forwardExplain the purpose of a statement of retained earnings.need anarrow_forward
arrow_back_ios
SEE MORE QUESTIONS
arrow_forward_ios
Recommended textbooks for you
 MarketingMarketingISBN:9780357033791Author:Pride, William MPublisher:South Western Educational Publishing
 Contemporary MarketingMarketingISBN:9780357033777Author:Louis E. Boone, David L. KurtzPublisher:Cengage Learning
Marketing
Marketing
ISBN:9780357033791
Author:Pride, William M
Publisher:South Western Educational Publishing
Contemporary Marketing
Marketing
ISBN:9780357033777
Author:Louis E. Boone, David L. Kurtz
Publisher:Cengage Learning
Propositional Logic, Propositional Variables & Compound Propositions; Author: Neso Academy;https://www.youtube.com/watch?v=Ib5njCwNMdk;License: Standard YouTube License, CC-BY
Propositional Logic - Discrete math; Author: Charles Edeki - Math Computer Science Programming;https://www.youtube.com/watch?v=rL_8y2v1Guw;License: Standard YouTube License, CC-BY
DM-12-Propositional Logic-Basics; Author: GATEBOOK VIDEO LECTURES;https://www.youtube.com/watch?v=pzUBrJLIESU;License: Standard Youtube License
Lecture 1 - Propositional Logic; Author: nptelhrd;https://www.youtube.com/watch?v=xlUFkMKSB3Y;License: Standard YouTube License, CC-BY
MFCS unit-1 || Part:1 || JNTU || Well formed formula || propositional calculus || truth tables; Author: Learn with Smily;https://www.youtube.com/watch?v=XV15Q4mCcHc;License: Standard YouTube License, CC-BY