
Essentials of Business Analytics (MindTap Course List)
2nd Edition
ISBN: 9781305627734
Author: Jeffrey D. Camm, James J. Cochran, Michael J. Fry, Jeffrey W. Ohlmann, David R. Anderson
Publisher: Cengage Learning
expand_more
expand_more
format_list_bulleted
Videos
Textbook Question
Chapter 3, Problem 11P
The International Organization of Motor Vehicle Manufacturers (officially known as the Organisation Internationale des Constructeurs d’Automobiles, OICA) provides data on worldwide vehicle production by manufacturer. The following table shows vehicle production numbers for four different manufacturers for five recent years. Data are in millions of vehicles.
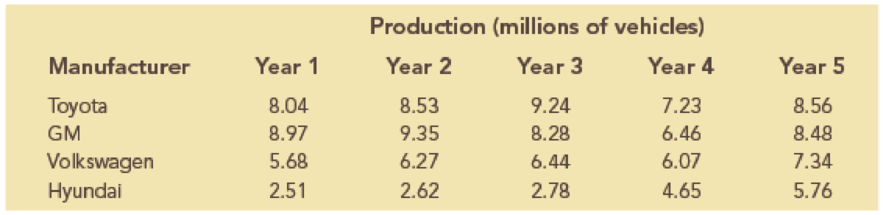
- a. Construct a line chart for the time series data for years 1 through 5 showing the number of vehicles manufactured by each automotive company. Show the time series for all four manufacturers on the same graph.
- b. What does the line chart indicate about vehicle production amounts from years 1 through 5? Discuss.
- c. Construct a clustered-bar chart showing vehicles produced by automobile manufacturer using the year 1 through 5 data. Represent the years of production along the horizontal axis, and cluster the production amounts for the four manufacturers in each year. Which company is the leading manufacturer in each year?
Expert Solution & Answer
Want to see the full answer?
Check out a sample textbook solution
Students have asked these similar questions
Examine the Variables: Carefully review and note the names of all variables in the dataset. Examples of these variables include:
Mileage (mpg)
Number of Cylinders (cyl)
Displacement (disp)
Horsepower (hp)
Research: Google to understand these variables.
Statistical Analysis: Select mpg variable, and perform the following statistical tests. Once you are done with these tests using mpg variable, repeat the same with hp
Mean
Median
First Quartile (Q1)
Second Quartile (Q2)
Third Quartile (Q3)
Fourth Quartile (Q4)
10th Percentile
70th Percentile
Skewness
Kurtosis
Document Your Results:
In RStudio: Before running each statistical test, provide a heading in the format shown at the bottom. “# Mean of mileage – Your name’s command”
In Microsoft Word: Once you've completed all tests, take a screenshot of your results in RStudio and paste it into a Microsoft Word document. Make sure that snapshots are very clear. You will need multiple snapshots. Also transfer these results to the…
Chapter 3 Solutions
Essentials of Business Analytics (MindTap Course List)
Ch. 3 - A sales manager is trying to determine appropriate...Ch. 3 - The following table shows an example of gross...Ch. 3 - The following table provides monthly revenue...Ch. 3 - In the file MajorSalary, data have been collected...Ch. 3 - Entrepreneur magazine ranks franchises. Among the...Ch. 3 - The file MutualFunds contains a data set with...Ch. 3 - The file TaxData contains information from federal...Ch. 3 - The file FDICBankFailures contains data on...Ch. 3 - The following 20 observations are for two...Ch. 3 - The file Fortune500 contains data for profits and...
Ch. 3 - The International Organization of Motor Vehicle...Ch. 3 - Prob. 12PCh. 3 - Prob. 13PCh. 3 - The total number of term life insurance contracts...Ch. 3 - An automotive company is considering the...Ch. 3 - Consider the following survey results regarding...Ch. 3 - The Northwest regional manager of Logan Outdoor...Ch. 3 - The Ajax Company uses a portfolio approach to...Ch. 3 - Heat maps can be very useful for identifying...Ch. 3 - The following table shows monthly revenue for six...Ch. 3 - Prob. 21PCh. 3 - Aurora Radiological Services is a health care...Ch. 3 - The motion picture industry is an extremely...
Knowledge Booster


Learn more about
Need a deep-dive on the concept behind this application? Look no further. Learn more about this topic, statistics and related others by exploring similar questions and additional content below.Similar questions
- 2 (VaR and ES) Suppose X1 are independent. Prove that ~ Unif[-0.5, 0.5] and X2 VaRa (X1X2) < VaRa(X1) + VaRa (X2). ~ Unif[-0.5, 0.5]arrow_forward8 (Correlation and Diversification) Assume we have two stocks, A and B, show that a particular combination of the two stocks produce a risk-free portfolio when the correlation between the return of A and B is -1.arrow_forward9 (Portfolio allocation) Suppose R₁ and R2 are returns of 2 assets and with expected return and variance respectively r₁ and 72 and variance-covariance σ2, 0%½ and σ12. Find −∞ ≤ w ≤ ∞ such that the portfolio wR₁ + (1 - w) R₂ has the smallest risk.arrow_forward
- 7 (Multivariate random variable) Suppose X, €1, €2, €3 are IID N(0, 1) and Y2 Y₁ = 0.2 0.8X + €1, Y₂ = 0.3 +0.7X+ €2, Y3 = 0.2 + 0.9X + €3. = (In models like this, X is called the common factors of Y₁, Y₂, Y3.) Y = (Y1, Y2, Y3). (a) Find E(Y) and cov(Y). (b) What can you observe from cov(Y). Writearrow_forward1 (VaR and ES) Suppose X ~ f(x) with 1+x, if 0> x > −1 f(x) = 1−x if 1 x > 0 Find VaRo.05 (X) and ES0.05 (X).arrow_forwardJoy is making Christmas gifts. She has 6 1/12 feet of yarn and will need 4 1/4 to complete our project. How much yarn will she have left over compute this solution in two different ways arrow_forward
- Solve for X. Explain each step. 2^2x • 2^-4=8arrow_forwardOne hundred people were surveyed, and one question pertained to their educational background. The results of this question and their genders are given in the following table. Female (F) Male (F′) Total College degree (D) 30 20 50 No college degree (D′) 30 20 50 Total 60 40 100 If a person is selected at random from those surveyed, find the probability of each of the following events.1. The person is female or has a college degree. Answer: equation editor Equation Editor 2. The person is male or does not have a college degree. Answer: equation editor Equation Editor 3. The person is female or does not have a college degree.arrow_forwardneed help with part barrow_forward
- Suppose you know that Bob's test score is above the mean, but he doesn't remember by how much. At least how many students must score lower than Bob?arrow_forwardIf a baby's weight is at the median, what's her percentile?arrow_forwardAt the same restaurant as in Question 19 with the same normal distribution, what's the chance of it taking no more than 15 minutes to get service?arrow_forward
arrow_back_ios
SEE MORE QUESTIONS
arrow_forward_ios
Recommended textbooks for you
 Holt Mcdougal Larson Pre-algebra: Student Edition...AlgebraISBN:9780547587776Author:HOLT MCDOUGALPublisher:HOLT MCDOUGAL
 Functions and Change: A Modeling Approach to Coll...AlgebraISBN:9781337111348Author:Bruce Crauder, Benny Evans, Alan NoellPublisher:Cengage Learning
 Glencoe Algebra 1, Student Edition, 9780079039897...AlgebraISBN:9780079039897Author:CarterPublisher:McGraw Hill
 Trigonometry (MindTap Course List)TrigonometryISBN:9781305652224Author:Charles P. McKeague, Mark D. TurnerPublisher:Cengage Learning
 Trigonometry (MindTap Course List)TrigonometryISBN:9781337278461Author:Ron LarsonPublisher:Cengage Learning
Holt Mcdougal Larson Pre-algebra: Student Edition...
Algebra
ISBN:9780547587776
Author:HOLT MCDOUGAL
Publisher:HOLT MCDOUGAL
Functions and Change: A Modeling Approach to Coll...
Algebra
ISBN:9781337111348
Author:Bruce Crauder, Benny Evans, Alan Noell
Publisher:Cengage Learning
Glencoe Algebra 1, Student Edition, 9780079039897...
Algebra
ISBN:9780079039897
Author:Carter
Publisher:McGraw Hill
Trigonometry (MindTap Course List)
Trigonometry
ISBN:9781305652224
Author:Charles P. McKeague, Mark D. Turner
Publisher:Cengage Learning
Trigonometry (MindTap Course List)
Trigonometry
ISBN:9781337278461
Author:Ron Larson
Publisher:Cengage Learning
Finite Math: Markov Chain Example - The Gambler's Ruin; Author: Brandon Foltz;https://www.youtube.com/watch?v=afIhgiHVnj0;License: Standard YouTube License, CC-BY
Introduction: MARKOV PROCESS And MARKOV CHAINS // Short Lecture // Linear Algebra; Author: AfterMath;https://www.youtube.com/watch?v=qK-PUTuUSpw;License: Standard Youtube License
Stochastic process and Markov Chain Model | Transition Probability Matrix (TPM); Author: Dr. Harish Garg;https://www.youtube.com/watch?v=sb4jo4P4ZLI;License: Standard YouTube License, CC-BY