Videos
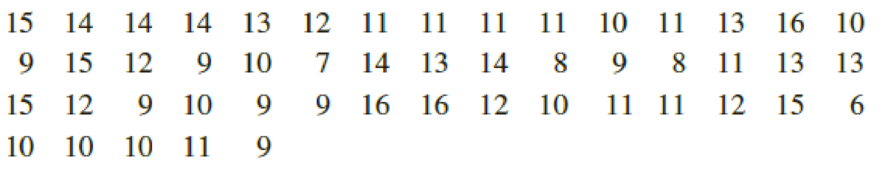
Agriculture: Bell Peppers The pathogen Phytophthora capsici causes bell pepper plants to wilt and die. A research project was designed to study the effect of soil water content and the spread of the disease in fields of bell peppers (Source: Journal of Agricultural, Biological, and Environmental Statistics, Vol. 2, No. 2). It is thought that too much water helps spread the disease. The fields were divided into rows and quadrants. The soil water content (percent of water by volume of soil) was determined for each plot. An important first step in such a research project is to give a statistical description of the data.
soil water content for bell Pepper study
- (a) Make a box-and-whisker plot of the data. Find the
interquartile range . - (b) Grouped Data Make a frequency table using four classes. Then estimate the
mean and sample standard deviation using the frequency table. Compute a 75% Chebyshev interval centered about the mean. - (c) If you have a statistical calculator or computer, use it to find the actual sample mean and sample standard deviation.
a.
Draw the box-and-whisker plot.
Find the interquartile range.
Answer to Problem 10CRP
The box-and-whisker plot is shown below:
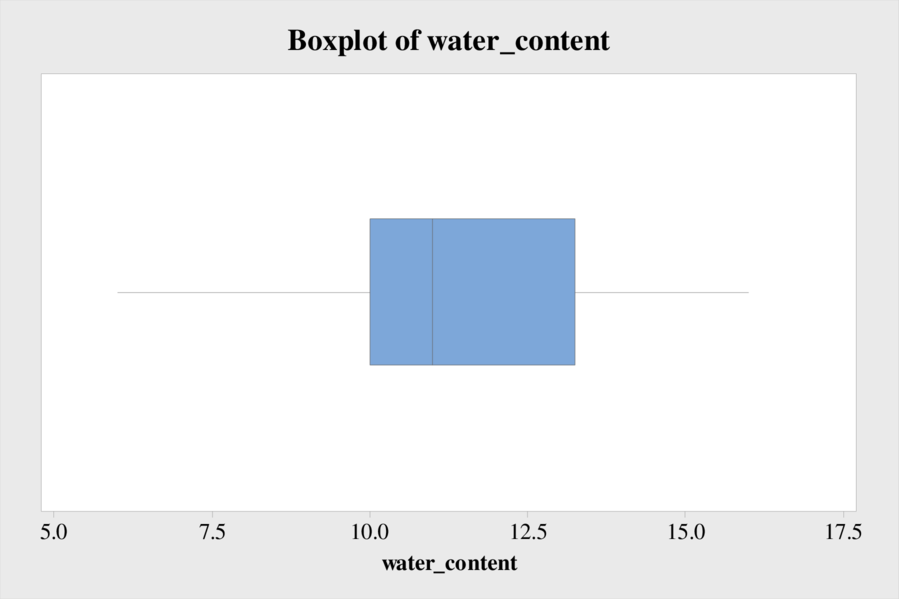
The interquartile range is 3.25.
Explanation of Solution
Step-by-step procedure to draw the box-and-whisker plot using MINITAB software:
- Choose Graph > Boxplot or Stat > EDA > Boxplot.
- Under One Y, choose Simple. Click OK.
- In Graph variables, enter the data of water_content.
- Click OK in all dialogue boxes.
Step-by-step procedure to obtain the interquartile range using MINITAB software:
- Choose Stat > Basic Statistics > Display Descriptive Statistics.
- In Variables enter the columns water_content.
- Check Options, Select Interquartile range.
- Click OK in all dialogue boxes.
Output obtained using the MINITAB software is given below:
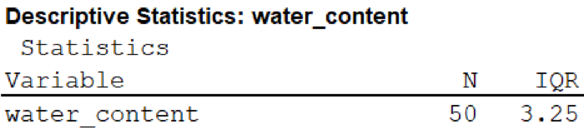
From the output, the interquartile range is 3.25.
b.
Create a table for a frequency table with four classes.
Find the mean and sample standard deviation using the frequency table.
Find the 75% Chebyshev interval centered about the mean.
Answer to Problem 10CRP
The frequency distribution table is given below:
| Class Limits | Midpoints | Frequency |
| 6-8 | 7 | 4 |
| 9-11 | 10 | 24 |
| 12-14 | 13 | 15 |
| 15-17 | 16 | 7 |
The value of the sample mean is 11.5.
Thesample standard deviation is 2.52.
The 75% Chebyshev interval centered about the mean isbetween 6.46 and 16.54.
Explanation of Solution
Midpoint:
The midpoint is calculated as given below:
Frequency:
Frequency is the number of data points that fall under each class.
From the given data set, the largest data point is 16 and the smallest data point is 6.
Class Width:
The class width is calculated as follows:
The class width is 3. Hence, the lower class limit for the second class 9 is calculated by adding 3 to 6. Following this pattern, all the lower class limits are established. Then, the upper class limits are calculated.
The frequency distribution table is given below:
| Class Limits | Midpoints | Frequency |
| 6-8 | 7 | 4 |
| 9-11 | 10 | 24 |
| 12-14 | 13 | 15 |
| 15-17 | 16 | 7 |
The formulaefor the sample mean, the sample variance, and the sample standard deviation for grouped data aregiven below:
Where, x is the midpoint,
The midpoint and the frequency areobtained from the histogram.
The value of
| Midpoint (x) | Frequency (f) | xf |
| 7 | 4 | 28 |
| 10 | 24 | 240 |
| 13 | 15 | 195 |
| 16 | 7 | 112 |
The value of sample mean is obtained below:
Thus, the value of the sample mean is 11.5.
The value of
| Midpoint (x) | Frequency (f) | |||
| 7 | 4 | –4.5 | 20.25 | 81 |
| 10 | 24 | –1.5 | 2.25 | 54 |
| 13 | 15 | 1.5 | 2.25 | 33.75 |
| 16 | 7 | 4.5 | 20.25 | 141.75 |
The sample standard deviation is obtained below:
Thus, the sample standard deviation is 2.52.
The 75% Chebyshev interval centered on the mean is obtained below:
Thus, the 75% Chebyshev interval centered about the mean isbetween 6.46 and 16.54.
c.
Find the actual sample mean and sample standard deviation using a statistical computer.
Answer to Problem 10CRP
The value of actual sample mean is 11.5.
The value of sample standard deviation is 2.44.
Explanation of Solution
Step-by-step procedure to obtain the mean and standard deviation using MINITAB software:
- Choose Stat > Basic Statistics > Display Descriptive Statistics.
- In Variables enter the columns Percentage_Democrats.
- Check Options, Select Mean, and standard deviation.
- Click OK in all dialogue boxes.
Output obtained using the MINITAB software is given below:
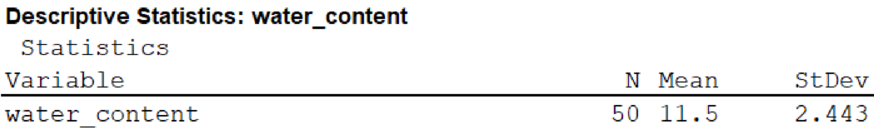
From the MINITAB output, the value of actual sample mean is 11.5 and the value of sample standard deviation is 2.44.
Want to see more full solutions like this?
Chapter 3 Solutions
WebAssign Printed Access Card for Brase/Brase's Understandable Statistics: Concepts and Methods, 12th Edition, Single-Term


- 2 (VaR and ES) Suppose X1 are independent. Prove that ~ Unif[-0.5, 0.5] and X2 VaRa (X1X2) < VaRa(X1) + VaRa (X2). ~ Unif[-0.5, 0.5]arrow_forward8 (Correlation and Diversification) Assume we have two stocks, A and B, show that a particular combination of the two stocks produce a risk-free portfolio when the correlation between the return of A and B is -1.arrow_forward9 (Portfolio allocation) Suppose R₁ and R2 are returns of 2 assets and with expected return and variance respectively r₁ and 72 and variance-covariance σ2, 0%½ and σ12. Find −∞ ≤ w ≤ ∞ such that the portfolio wR₁ + (1 - w) R₂ has the smallest risk.arrow_forward
- 7 (Multivariate random variable) Suppose X, €1, €2, €3 are IID N(0, 1) and Y2 Y₁ = 0.2 0.8X + €1, Y₂ = 0.3 +0.7X+ €2, Y3 = 0.2 + 0.9X + €3. = (In models like this, X is called the common factors of Y₁, Y₂, Y3.) Y = (Y1, Y2, Y3). (a) Find E(Y) and cov(Y). (b) What can you observe from cov(Y). Writearrow_forward1 (VaR and ES) Suppose X ~ f(x) with 1+x, if 0> x > −1 f(x) = 1−x if 1 x > 0 Find VaRo.05 (X) and ES0.05 (X).arrow_forwardJoy is making Christmas gifts. She has 6 1/12 feet of yarn and will need 4 1/4 to complete our project. How much yarn will she have left over compute this solution in two different ways arrow_forward
- Solve for X. Explain each step. 2^2x • 2^-4=8arrow_forwardOne hundred people were surveyed, and one question pertained to their educational background. The results of this question and their genders are given in the following table. Female (F) Male (F′) Total College degree (D) 30 20 50 No college degree (D′) 30 20 50 Total 60 40 100 If a person is selected at random from those surveyed, find the probability of each of the following events.1. The person is female or has a college degree. Answer: equation editor Equation Editor 2. The person is male or does not have a college degree. Answer: equation editor Equation Editor 3. The person is female or does not have a college degree.arrow_forwardneed help with part barrow_forward
- Suppose you know that Bob's test score is above the mean, but he doesn't remember by how much. At least how many students must score lower than Bob?arrow_forwardIf a baby's weight is at the median, what's her percentile?arrow_forwardAt the same restaurant as in Question 19 with the same normal distribution, what's the chance of it taking no more than 15 minutes to get service?arrow_forward
 Linear Algebra: A Modern IntroductionAlgebraISBN:9781285463247Author:David PoolePublisher:Cengage Learning
 Big Ideas Math A Bridge To Success Algebra 1: Stu...AlgebraISBN:9781680331141Author:HOUGHTON MIFFLIN HARCOURTPublisher:Houghton Mifflin Harcourt
 Glencoe Algebra 1, Student Edition, 9780079039897...AlgebraISBN:9780079039897Author:CarterPublisher:McGraw Hill
 Holt Mcdougal Larson Pre-algebra: Student Edition...AlgebraISBN:9780547587776Author:HOLT MCDOUGALPublisher:HOLT MCDOUGAL
 Functions and Change: A Modeling Approach to Coll...AlgebraISBN:9781337111348Author:Bruce Crauder, Benny Evans, Alan NoellPublisher:Cengage Learning