
Concept explainers
Videos
1.
Introduction:
Variable costs and Fixed costs:
Variable costs are those that increase or decrease with the general volume of work. Some of the examples of variable costs are sales commissions, labor costs, raw material costs, etc. Fixed costs are those costs that remain fixed irrespective of the volume of work. Some of the examples of fixed costs are office rent, administrative expenses,
Least square regression method:
The least-square regression method uses the regression line to classify the total cost into variable and fixed cost and thus minimizing the sum of squares of the errors and hence we can get the best line of fit with minimum variances. The least-square regression can be expressed as Y = a + bx
Where Y is Total cost
A is the total fixed cost
B is the variable cost
X is the activity level
To prepare: a scatter plot graph.
1.
Answer to Problem 2A.2E
This is the scatterplot graph for the B rental car.
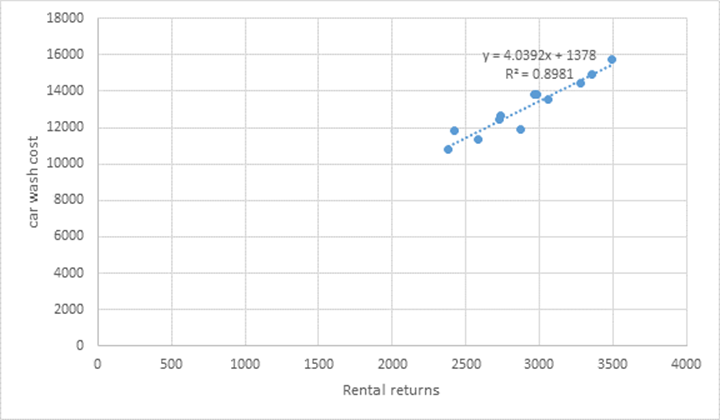
Explanation of Solution
According to the given information the rental returns and car wash costs of B rental cars have been given and we have to prepare a scatter graph plot where the car wash cost should be on the vertical axis and the rental returns on the horizontal axis. To prepare the scatter graph first we have to go to insert option and select scatter graph from charts. The next step is to enter the X values and Y values and then we will get the graph. Now we can add trend line and axis title by clicking on the + symbol next to the graph. After adding the trend line we can click on the arrow button next to the trend line and select more options and then in that we have to checkmark display equation and display R squared value on the chart. The following is the data for plotting the graph:
| Rental returns | Car wash costs ($) |
| 2380 | 10825 |
| 2421 | 11865 |
| 2586 | 11332 |
| 2725 | 12422 |
| 2968 | 13850 |
| 3281 | 14419 |
| 3353 | 14935 |
| 3489 | 15738 |
| 3057 | 13563 |
| 2876 | 11889 |
| 2735 | 12683 |
| 2983 | 13796 |
2.
Introduction:
Variable costs are those that increase or decrease with the general volume of work. Some of the examples of variable costs are sales commissions, labor costs, raw material costs, etc. Fixed costs are those costs that remain fixed irrespective of the volume of work. Some of the examples of fixed costs are office rent, administrative expenses, depreciation, etc.
Least square regression method:
The least-square regression method uses the regression line to classify the total cost into variable and fixed cost and thus minimizing the sum of squares of the errors and hence we can get the best line of fit with minimum variances. The least-square regression can be expressed as Y = a + bx
Where Y is Total cost
A is the total fixed cost
B is the variable cost
X is the activity level
To calculate: the variable cost per rental return and the monthly fixed washing cars using least square regression method.
2.
Answer to Problem 2A.2E
Thus, the variable cost per unit is $4.04 and the fixed cost per unit is $145583 for Bargain rental car.
Explanation of Solution
To calculate the variable cost per rental return and the monthly fixed washing cars using the least square regression method first we have to calculate the X, Y, X2 and XY. In the given data the rental return is taken as X and car wash costs is taken as Y, let us now calculate the X2 and XY:
| Months | X | Y | X2 | XY |
| January | 2380 | 10825 | 5664400 | 25763500 |
| February | 2421 | 11865 | 5861241 | 28725165 |
| March | 2586 | 11332 | 6687396 | 29304552 |
| April | 2725 | 12422 | 7425625 | 33849950 |
| May | 2968 | 13850 | 8809024 | 41106800 |
| June | 3281 | 14419 | 10764961 | 47308739 |
| July | 3353 | 14935 | 11242609 | 50077055 |
| August | 3489 | 15738 | 12173121 | 54909882 |
| September | 3057 | 13563 | 9345249 | 41462091 |
| October | 2876 | 11889 | 8271376 | 34192764 |
| November | 2735 | 12683 | 7480225 | 34688005 |
| December | 2983 | 13796 | 8898289 | 41153468 |
| Total | 34854 | 157317 | 102623516 | 462541971 |
Now let us calculate the variable cost using following formula:
Variable cost per unit
Now, let us calculate the fixed cost per unit using following formula:
Fixed cost per unit
Want to see more full solutions like this?
Chapter 2A Solutions
MANAG ACCT F/..(LL)+CONNECT W/PROCTORIO+


- I am searching for the accurate solution to this general accounting problem with the right approach.arrow_forwardI need help solving this general accounting question with the proper methodology.arrow_forwardIf a business buys supplies on credit, which of the following accounts will be affected?a) Supplies and Accounts Payableb) Cash and Suppliesc) Accounts Receivable and Suppliesd) Supplies and Cashno aiarrow_forward
 Pkg Acc Infor Systems MS VISIO CDFinanceISBN:9781133935940Author:Ulric J. GelinasPublisher:CENGAGE L
 Managerial Accounting: The Cornerstone of Busines...AccountingISBN:9781337115773Author:Maryanne M. Mowen, Don R. Hansen, Dan L. HeitgerPublisher:Cengage Learning