Concept explainers
Videos
(a.)
A labelled diagram of the sculpture in terms of
A labelled diagram of the sculpture in terms of

Given:
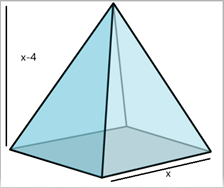
A sculpture is shaped as a pyramid with a square base.
The height of the pyramid is
The volume of the sculpture is
Concept used:
Assuming an unknown dimension as
Calculation:
Let
It is given that the height of the pyramid is
Then, the height of the pyramid shaped sculpture is
Now, a labelled diagram of the sculpture is given as follows,

Conclusion:
A labelled diagram of the sculpture in terms of
(b.)
A function that gives the volume
It has been determined that the function that gives the volume
Given:
A sculpture is shaped as a pyramid with a square base.
The height of the pyramid is
The volume of the sculpture is
Concept used:
The volume
Calculation:
As assumed previously,
Then, the area of the square base (in square inches) is given as
Now, according to the discussed formula, the volume
Rewriting,
This is the required function that gives the volume
Conclusion:
It has been determined that the function that gives the volume
(c.)
The graph of the function obtained in part (b) and the estimate of the value of
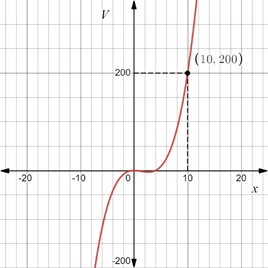
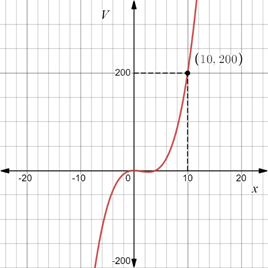
The graph of the function obtained in part (b) is given as:
It has been determined that the estimate of the value of
Given:
A sculpture is shaped as a pyramid with a square base.
The height of the pyramid is
The volume of the sculpture is
Concept used:
If either the abscissa or the ordinate is known, the corresponding ordinate or the abscissa can be obtained from the graph of the function.
Calculation:
The function obtained in part (b) is,
The graph of this function is given as,

It is given that the volume of the sculpture is
So,
It can be seen from the graph that
This is the required estimate.
Conclusion:
The graph of the function obtained in part (b) is given as:
It has been determined that the estimate of the value of
(d.)
The value of
The value of
It has been determined that the base of the sculpture is
Given:
A sculpture is shaped as a pyramid with a square base.
The height of the pyramid is
The volume of the sculpture is
Concept used:
An equation can be solved by factorizing.
Calculation:
The function obtained in part (b) is,
It is given that the volume of the sculpture is
So,
Put
Simplifying,
On further simplification,
Finally,
Factorizing,
Note that the discriminant of
This implies that the roots of
So, the only real root of the obtained equation is
Now, the estimated value from part (c.) was also
As assumed in part (a), the length of a side of the square base is
So, the base of the sculpture is
Conclusion:
The value of
It has been determined that the base of the sculpture is
Chapter 2 Solutions
Mcdougal Littell Algebra 2: Student Edition (c) 2004 2004


- Assume that you fancy polynomial splines, while you actually need ƒ(t) = e²/3 – 1 for t€ [−1, 1]. See the figure for a plot of f(t). Your goal is to approximate f(t) with an inter- polating polynomial spline of degree d that is given as sa(t) = • Σk=0 Pd,k bd,k(t) so that sd(tk) = = Pd,k for tk = −1 + 2 (given d > 0) with basis functions bd,k(t) = Σi±0 Cd,k,i = • The special case of d 0 is trivial: the only basis function b0,0 (t) is constant 1 and so(t) is thus constant po,0 for all t = [−1, 1]. ...9 The d+1 basis functions bd,k (t) form a ba- sis Bd {ba,o(t), ba,1(t), bd,d(t)} of the function space of all possible sα (t) functions. Clearly, you wish to find out, which of them given a particular maximal degree d is the best-possible approximation of f(t) in the least- squares sense. _ 1 0.9 0.8 0.7 0.6 0.5 0.4 0.3 0.2 0.1 0 -0.1 -0.2 -0.3 -0.4 -0.5 -0.6 -0.7 -0.8 -0.9 -1 function f(t) = exp((2t)/3) - 1 to project -1 -0.9 -0.8 -0.7 -0.6 -0.5 -0.4 -0.3 -0.2 -0.1 0 0.1 0.2 0.3 0.4 0.5…arrow_forwardAn image processor considered a 750×750 pixels large subset of an image and converted it into gray-scale, resulting in matrix gIn - a false-color visualization of gIn is shown in the top-left below. He prepared a two-dim. box filter f1 as a 25×25 matrix with only the 5×5 values in the middle being non-zero – this filter is shown in the top-middle position below. He then convolved £1 with itself to get £2, before convolving £2 with itself to get f3. In both of the steps, he maintained the 25×25 size. Next, he convolved gIn with £3 to get gl. Which of the six panels below shows g1? Argue by explaining all the steps, so far: What did the image processor do when preparing ₤3? What image processing operation (from gin to g1) did he prepare and what's the effect that can be seen? Next, he convolved the rows of f3 with filter 1/2 (-1, 8, 0, -8, 1) to get f4 - you find a visualization of filter f 4 below. He then convolved gIn with f4 to get g2 and you can find the result shown below. What…arrow_forward3ur Colors are enchanting and elusive. A multitude of color systems has been proposed over a three-digits number of years - maybe more than the number of purposes that they serve... - Everyone knows the additive RGB color system – we usually serve light-emitting IT components like monitors with colors in that system. Here, we use c = (r, g, b) RGB with r, g, bЄ [0,1] to describe a color c. = T For printing, however, we usually use the subtractive CMY color system. The same color c becomes c = (c, m, y) CMY (1-c, 1-m, 1-y) RGB Note how we use subscripts to indicate with coordinate system the coordinates correspond to. Explain, why it is not possible to find a linear transformation between RGB and CMY coordinates. Farbenlehr c von Goethe Erster Band. Roſt einen Defte mit fergen up Tübingen, is et 3. Cotta'fden Babarblung. ISIO Homogeneous coordinates give us a work-around: If we specify colors in 4D, instead, with the 4th coordinate being the homogeneous coordinate h so that every actual…arrow_forward
- Can someone provide an answer & detailed explanation please? Thank you kindly!arrow_forwardGiven the cubic function f(x) = x^3-6x^2 + 11x- 6, do the following: Plot the graph of the function. Find the critical points and determine whether each is a local minimum, local maximum, or a saddle point. Find the inflection point(s) (if any).Identify the intervals where the function is increasing and decreasing. Determine the end behavior of the graph.arrow_forwardGiven the quadratic function f(x) = x^2-4x+3, plot the graph of the function and find the following: The vertex of the parabola .The x-intercepts (if any). The y-intercept. Create graph also before solve.arrow_forward
- what model best fits this dataarrow_forwardRound as specified A) 257 down to the nearest 10’s place B) 650 to the nearest even hundreds, place C) 593 to the nearest 10’s place D) 4157 to the nearest hundreds, place E) 7126 to the nearest thousand place arrow_forwardEstimate the following products in two different ways and explain each method  A) 52x39 B) 17x74 C) 88x11 D) 26x42arrow_forward
 Algebra and Trigonometry (6th Edition)AlgebraISBN:9780134463216Author:Robert F. BlitzerPublisher:PEARSON
 Contemporary Abstract AlgebraAlgebraISBN:9781305657960Author:Joseph GallianPublisher:Cengage Learning
 Linear Algebra: A Modern IntroductionAlgebraISBN:9781285463247Author:David PoolePublisher:Cengage Learning
 Algebra And Trigonometry (11th Edition)AlgebraISBN:9780135163078Author:Michael SullivanPublisher:PEARSON
 Introduction to Linear Algebra, Fifth EditionAlgebraISBN:9780980232776Author:Gilbert StrangPublisher:Wellesley-Cambridge Press
 College Algebra (Collegiate Math)AlgebraISBN:9780077836344Author:Julie Miller, Donna GerkenPublisher:McGraw-Hill Education