
a.
To Describe: The domain for the given situation.
The domain for the given situation is
Given information:
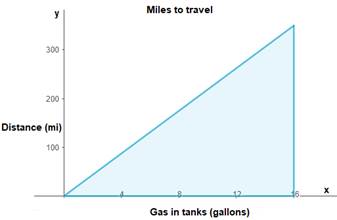
The graph relates the amount of gas in the tank of the car to the distance the car can drive.

Explanation:
Given the graph is,

From the graph, due to the solid line, not being dashed, we include
A domain is a set of possible input values. Graphs have domains consisting of all input values shown on the
So, in
Interval notation represents a set of values using brackets for included values and parentheses for non-included values.
Thus, the domain for the situation is
b.
To Describe: The reason of graph being stopped.
Since the car cannot hold more than
Given information:
The graph relates the amount of gas in the tank of the car to the distance the car can drive.

Explanation:
The reason of graph being stopped:
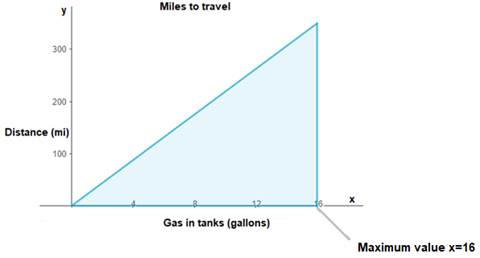
From the given graph, it's shown that the maximum gas in tanks is
completion of
c.
To Describe: The reason for showing only the first quadrant.
Only the first quadrant has positive files. Because, negative numbers are not possible in the given situation.
Given information:
The graph relates the amount of gas in the tank of the car to the distance the car can drive.

Explanation:
The reason for showing only the first quadrant:
In the graph, one cannot physically drive a negative number of miles nor have a negative amount of gas therefore it stops at
Only the first quadrant has positive values. So, only the first quadrant shown.
d.
To Explain: Whether every point in the solution region be a solution.
Yes, every point in the solution region be a solution.
Given information:
The graph relates the amount of gas in the tank of the car to the distance the car can drive.
Explanation:
Graphs are pictures of answers, and shaded areas on a graph show the answers that
support the inequality. So, every point in the solution region be a solution.
e.
To Write: The inequality for the given graph.
The inequality for the given graph is
Given information:
The graph relates the amount of gas in the tank of the car to the distance the car can drive.

Explanation:
Write the inequality:
The slope of the line can be found by selecting two points
Substitute
of gas in the tank are directly related), where
Since, the slope formula is
Since the region below the boundary line is shaded, the inequality for the given graph is:
f.
To Find: The coefficient of
The coefficient of
Given information:
The graph relates the amount of gas in the tank of the car to the distance the car can drive.

Explanation:
In this equation, the coefficient
Since, from part
So, the co-efficient of
Chapter 2 Solutions
EP ALGEBRA 2-COMMON CORE-ONLINE ACCESS

- For each graph below, state whether it represents a function. Graph 1 24y Graph 2 Graph 3 4 2 -8 -6 -4 -2 -2 2 4 6 Function? ○ Yes ○ No ○ Yes ○ No Graph 4 Graph 5 8 Function? Yes No Yes No -2. ○ Yes ○ No Graph 6 4 + 2 4 -8 -6 -4 -2 2 4 6 8 Yes -4++ Noarrow_forwardPractice k Help ises A 96 Anewer The probability that you get a sum of at least 10 is Determine the number of ways that the specified event can occur when two number cubes are rolled. 1. Getting a sum of 9 or 10 3. Getting a sum less than 5 2. Getting a sum of 6 or 7 4. Getting a sum that is odd Tell whether you would use the addition principle or the multiplication principle to determine the total number of possible outcomes for the situation described. 5. Rolling three number cubes 6. Getting a sum of 10 or 12 after rolling three number cubes A set of playing cards contains four groups of cards designated by color (black, red, yellow, and green) with cards numbered from 1 to 14 in each group. Determine the number of ways that the specified event can occur when a card is drawn from the set. 7. Drawing a 13 or 14 9. Drawing a number less than 4 8. Drawing a yellow or green card 10. Drawing a black, red, or green car The spinner is divided into equal parts. Find the specified…arrow_forwardAnswer the questionsarrow_forward
- Solve the problems on the imagearrow_forwardAsked this question and got a wrong answer previously: Third, show that v3 = (−√3, −3, 3)⊤ is an eigenvector of M3 . Also here find the correspondingeigenvalue λ3 . Just from looking at M3 and its components, can you say something about the remaining twoeigenvalues? If so, what would you say?arrow_forwardDetermine whether the inverse of f(x)=x^4+2 is a function. Then, find the inverse.arrow_forward
- The 173 acellus.com StudentFunctions inter ooks 24-25/08 R Mastery Connect ac ?ClassiD-952638111# Introduction - Surface Area of Composite Figures 3 cm 3 cm 8 cm 8 cm Find the surface area of the composite figure. 2 SA = [?] cm² 7 cm REMEMBER! Exclude areas where complex shapes touch. 7 cm 12 cm 10 cm might ©2003-2025 International Academy of Science. All Rights Reserved. Enterarrow_forwardYou are given a plane Π in R3 defined by two vectors, p1 and p2, and a subspace W in R3 spanned by twovectors, w1 and w2. Your task is to project the plane Π onto the subspace W.First, answer the question of what the projection matrix is that projects onto the subspace W and how toapply it to find the desired projection. Second, approach the task in a different way by using the Gram-Schmidtmethod to find an orthonormal basis for subspace W, before then using the resulting basis vectors for theprojection. Last, compare the results obtained from both methodsarrow_forwardPlane II is spanned by the vectors: - (2) · P² - (4) P1=2 P21 3 Subspace W is spanned by the vectors: 2 W1 - (9) · 1 W2 1 = (³)arrow_forward
 Algebra and Trigonometry (6th Edition)AlgebraISBN:9780134463216Author:Robert F. BlitzerPublisher:PEARSON
 Contemporary Abstract AlgebraAlgebraISBN:9781305657960Author:Joseph GallianPublisher:Cengage Learning
 Linear Algebra: A Modern IntroductionAlgebraISBN:9781285463247Author:David PoolePublisher:Cengage Learning
 Algebra And Trigonometry (11th Edition)AlgebraISBN:9780135163078Author:Michael SullivanPublisher:PEARSON
 Introduction to Linear Algebra, Fifth EditionAlgebraISBN:9780980232776Author:Gilbert StrangPublisher:Wellesley-Cambridge Press
 College Algebra (Collegiate Math)AlgebraISBN:9780077836344Author:Julie Miller, Donna GerkenPublisher:McGraw-Hill Education