Sub part (a):
Steady state level of output.
Sub part (a):
Explanation of Solution
The steady state level of output is calculated as follows:
The steady state level of output is 200 units.
Concept introduction:
Sub part (b):
Solow diagram to show short run impact.
Sub part (b):
Explanation of Solution
Figure 1 depicts Solow diagram which shows the short run impact of a 21% increase in the amount of labor available.
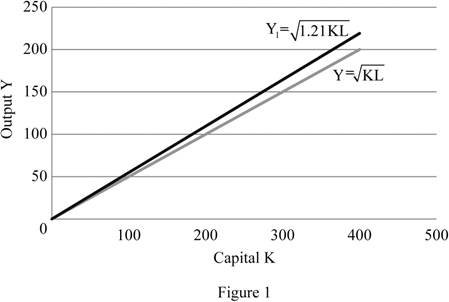
In figure 1, the horizontal axis represents the capital (K) and the vertical axis represents the output (Y). The initial production function
Concept introduction:
Economic growth: The economic growth is the increase in the overall goods and services produced per head in the economy over a specific period of time.
Solow growth rate The Solow growth rate is the rate of economic growth with given flexible price, and the existing real factors of capita, labor and knowledge. The Solow growth rate is an economy’s potential growth rate.
Sub part (c):
Steady state level of output.
Sub part (c):
Explanation of Solution
The new steady state level of output is calculated as follows:
The new steady state level of output is 220 units.
Concept introduction:
Economic growth: The economic growth is the increase in the overall goods and services produced per head in the economy over a specific period of time.
Sub part (d):
The new steady state level of output in the diagram.
Sub part (d):
Explanation of Solution
The new steady state level of output is 220 units which is depicted in the figure 1.
Sub part (e):
Action to gain long lasting benefits from the increase in capital stock.
Sub part (e):
Explanation of Solution
The initial production function is algebraically represented as follows:
Squaring both sides,
And solving for K, we get
Substitute K into the steady-state condition
And solve for Y by multiplying L and dividing by
Similarly, the new production function can be algebraically represented as follows:
Substitute K into the steady-state condition
And solve for Y by multiplying L and dividing by
Equating (1) in (2) we get
Substituting the values in equation (3) we get
Further, the percentage change in the output is depicted as follows:
This implies the steady-state level of output will grow by 21% per cent in the long run.
Concept introduction:
Production function: It is the relationship between the inputs employed by a firm and the maximum output the firm can produce with those inputs.
Sub part (f):
Output per worker.
Sub part (f):
Explanation of Solution
The output per worker in the initial steady state is calculated as follows:
The output per worker in the initial steady state is 2 units per labor.
The output per worker in the short run is calculated as follows:
The output per worker in short run is 1.82 units per labor.
The output per worker in the initial steady state is calculated as follows:
The output per worker in the long run is 2 units per labor.
Sub part (g):
New immigration policy and its effect.
Sub part (g):
Explanation of Solution
The citizens of the country are neither made worse off nor better off in the long run by a new immigration policy. This is because the new long-run level of output per worker compare with the initial level of output per worker remains unchanged which is 2 units per labor. This is unlike the short run effect which has lower output per worker. In the long run, the steady output level is determined largely by the
Concept introduction:
Depreciation: Depreciation is the process of decreasing the value of an asset over time especially due to wear and tear.
Investment: The investment is the money invests in terms of assets and building by the individual for the future consumption and profit making.
Sub part (h):
New steady state level of capital.
Sub part (h):
Explanation of Solution
The new steady state level of capital is calculated as follows
We know
Also
Equating all these we get,
Substituting the values we get
Thus the new steady state level of capital is 484, so that
Want to see more full solutions like this?
Chapter 28 Solutions
Modern Principles of Economics

- 4. Consider a put on the same underlier (Cisco). The strike is $50.85, which is the forward price. The owner of the call has the choice or option to buy at the strike. They get to see the market price S1 before they decide. We assume they are rational. What is the payoff from owning (also known as being long) the put? What is the payoff from selling (also known as being short) the put? Payoff from Put with Strike of k=$50.85 S1 Long $100 $95 $90 $85 $80 $75 $70 $65 $60 $55 $50.85 $50 $45 $40 $35 $30 $25 Shortarrow_forwardThe following table provides information on two technology companies, IBM and Cisco. Use the data to answer the following questions. Company IBM Cisco Systems Stock Price Dividend (trailing 12 months) $150.00 $50.00 $7.00 Dividend (next 12 months) $7.35 Dividend Growth 5.0% $2.00 $2.15 7.5% 1. You buy a futures contract instead of purchasing Cisco stock at $50. What is the one-year futures price, assuming the risk-free interest rate is 6%? Remember to adjust the futures price for the dividend of $2.15.arrow_forward5. Consider a one-year European-style call option on Cisco stock. The strike is $50.85, which is the forward price. The risk-free interest rate is 6%. Assume the stock price either doubles or halves each period. The price movement corresponds to u = 2 and d = ½ = 1/u. S1 = $100 Call payoff= SO = $50 S1 = $25 Call payoff= What is the call payoff for $1 = $100? What is the call payoff for S1 = $25?arrow_forward
- MC The diagram shows a pharmaceutical firm's demand curve and marginal cost curve for a new heart medication for which the firm holds a 20-year patent on its production. Assume this pharmaceutical firm charges a single price for its drug. At its profit-maximizing level of output, it will generate a total profit represented by OA. areas J+K. B. areas F+I+H+G+J+K OC. areas E+F+I+H+G. D. - it is not possible to determine with the informatio OE. the sum of areas A through K. (...) Po P1 Price F P2 E H 0 G B Q MR D ōarrow_forwardPrice Quantity $26 0 The marketing department of $24 20,000 Johnny Rockabilly's record company $22 40,000 has determined that the demand for his $20 60,000 latest CD is given in the table at right. $18 80,000 $16 100,000 $14 120,000 The record company's costs consist of a $240,000 fixed cost of recording the CD, an $8 per CD variable cost of producing and distributing the CD, plus the cost of paying Johnny for his creative talent. The company is considering two plans for paying Johnny. Plan 1: Johnny receives a zero fixed recording fee and a $4 per CD royalty for each CD that is sold. Plan 2: Johnny receives a $400,000 fixed recording fee and zero royalty per CD sold. Under either plan, the record company will choose the price of Johnny's CD so as to maximize its (the record company's) profit. The record company's profit is the revenues minus costs, where the costs include the costs of production, distribution, and the payment made to Johnny. Johnny's payment will be be under plan 2 as…arrow_forwardWhich of the following is the best example of perfect price discrimination? A. Universities give entry scholarships to poorer students. B. Students pay lower prices at the local theatre. ○ C. A hotel charges for its rooms according to the number of days left before the check-in date. ○ D. People who collect the mail coupons get discounts at the local food store. ○ E. An airline offers a discount to students.arrow_forward
- Consider the figure at the right. The profit of the single-price monopolist OA. is shown by area D+H+I+F+A. B. is shown by area A+I+F. OC. is shown by area D + H. ○ D. is zero. ○ E. cannot be calculated or shown with just the information given in the graph. (C) Price ($) B C D H FIG шо E MC ATC A MR D = AR Quantityarrow_forwardConsider the figure. A perfectly price-discriminating monopolist will produce ○ A. 162 units and charge a price equal to $69. ○ B. 356 units and charge a price equal to $52 for the last unit sold only. OC. 162 units and charge a price equal to $52. OD. 356 units and charge a price equal to the perfectly competitive price. Dollars per Unit $69 $52 MR 162 356 Output MC Darrow_forwardThe figure at right shows the demand line, marginal revenue line, and cost curves for a single-price monopolist. Now suppose the monopolist is able to charge a different price on each different unit sold. The profit-maximizing quantity for the monopolist is (Round your response to the nearest whole number.) The price charged for the last unit sold by this monopolist is $ (Round your response to the nearest dollar.) Price ($) 250 225- 200- The monopolist's profit is $ the nearest dollar.) (Round your response to MC 175- 150 ATC 125- 100- 75- 50- 25- 0- °- 0 20 40 60 MR 80 100 120 140 160 180 200 Quantityarrow_forward
- The diagram shows a pharmaceutical firm's demand curve and marginal cost curve for a new heart medication for which the firm holds a 20-year patent on its production. At its profit-maximizing level of output, it will generate a deadweight loss to society represented by what? A. There is no deadweight loss generated. B. Area H+I+J+K OC. Area H+I D. Area D + E ◇ E. It is not possible to determine with the information provided. (...) 0 Price 0 m H B GI A MR MC D Outparrow_forwardConsider the figure on the right. A single-price monopolist will produce ○ A. 135 units and charge a price equal to $32. B. 135 units and generate a deadweight loss. OC. 189 units and charge a price equal to the perfectly competitive price. ○ D. 189 units and charge a price equal to $45. () Dollars per Unit $45 $32 MR D 135 189 Output MC NGarrow_forwardSuppose a drug company cannot prevent resale between rich and poor countries and increases output from 3 million (serving only the rich country with a price of $80 per treatment) to 9 million (serving both the rich and the poor countries with a price of $30 per treatment). Marginal cost is constant and equal to $10 per treatment in both countries. The marginal revenue per treatment of increasing output from 3 million to 9 million is equal to ○ A. $20 per treatment, which is greater than the marginal cost of $10 per treatment and thus implies that profits will rise. ○ B. $20 per treatment, which is greater than zero and thus implies that profits will rise. ○ C. $30 per treatment, which is greater than the marginal cost of $10 per treatment and thus implies that profits will rise. ○ D. $5 per treatment, which is less than the marginal cost of $10 per treatment and thus implies that profits will fall. ○ E. $30 per treatment, which is less than the marginal revenue of $80 per treatment…arrow_forward

 Principles of Economics (12th Edition)EconomicsISBN:9780134078779Author:Karl E. Case, Ray C. Fair, Sharon E. OsterPublisher:PEARSON
 Engineering Economy (17th Edition)EconomicsISBN:9780134870069Author:William G. Sullivan, Elin M. Wicks, C. Patrick KoellingPublisher:PEARSON
 Principles of Economics (MindTap Course List)EconomicsISBN:9781305585126Author:N. Gregory MankiwPublisher:Cengage Learning
 Managerial Economics: A Problem Solving ApproachEconomicsISBN:9781337106665Author:Luke M. Froeb, Brian T. McCann, Michael R. Ward, Mike ShorPublisher:Cengage Learning
 Managerial Economics & Business Strategy (Mcgraw-...EconomicsISBN:9781259290619Author:Michael Baye, Jeff PrincePublisher:McGraw-Hill Education