
a.
To compare: The depression scores for the three qualities of sleep through a graph using the four-step process in data analysis and ANOVA.
a.
Answer to Problem 27.33E
The comparison of the depression scores for the three qualities of sleep is shown using MINITAB.
Output using the MINITAB software is given below:
At least one of the sleep qualities has different population
Explanation of Solution
Given info:
The dataset shows the quality of sleep and depression scores and here dataset of first seven individuals from a sample of 898 students.
| Quality of sleep: | poor | poor | border | poor | poor | optimal | border |
| Depression score: | 5 | 8 | 5 | 11 | 7 | 7 | 10 |
Justification:
The four-step process in data analysis is as follows,
Plan:
Check the condition and formulate a statistical question that can be answered with data, by any survey or poll. This is the most important step in the process. Here, the survey included questions on the sleep quality, moods, academic performance, physical health, and psychoactive drug use.
Collect:
Implement the plan to collect data through observations, interviews, questionnaires, databases, samplings, experimentation, or surveys. Here, the survey completed on a random sample of 898 students between the ages of 20 and 24 at a university. On the Pittsburgh Sleep Quality Index, students scoring less than or equal to 5 on index are classified as optimal sleepers, students scoring a 6 or 7 are classified as borderline, and those scoring over 7 are classified as poor sleepers.
Process:
Organize and summarize the collected data by graphical or numerical methods. Graph the numerical data using histograms, dot plots or box plots, and analyze the result.
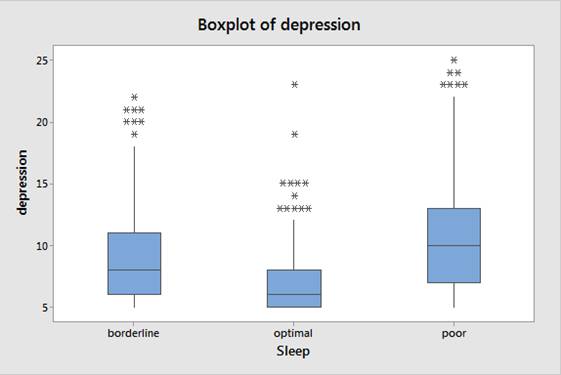
Boxplot:
Step by step procedure to obtain boxplot using the MINITAB software:
- Choose Graph > Boxplot.
- Under One Y, choose With Groups, and then click OK.
- In Graph variables, select the column of depression.
- In Categorical variables for grouping, select the column of Sleep.
- Click OK.
Output using the MINITAB software is given below:
ANOVA:
Step by step procedure to obtain ANOVA using the MINITAB software:
- Choose Stat > ANOVA > One-Way.
- In Response, select the column of depression.
- In Factor, select the column of Sleep.
- Click OK.
Output using the MINITAB software is given below:
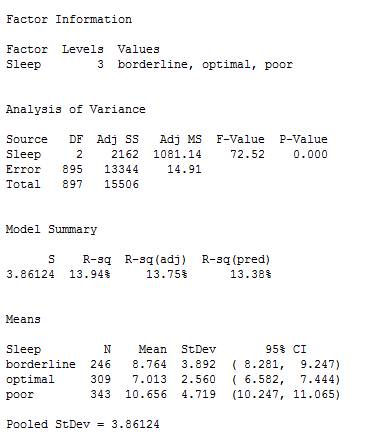
From the output, the standard deviation for borderline
The standard deviation must satisfy the rule of thumb.
The value 1.84 is less than 2. So, the condition is satisfied.
Thus, the ANOVA is used to compare the mean lengths for the three populations.
The boxplot shows that all the groups are having the outliers and provide the strong skewness. But the sample is larger up to 898. Therefore, it follows a
The standard deviation satisfy the rule of thumb and the resultant value is less than 2, so, ANOVA is used to compare the mean lengths for the three populations in the quality of sleep.
The four-step process in ANOVA is as follows,
The null and alternative hypothesis:
The Null Hypothesis:
The hypothesis states that there are no differences among the mean lengths.
The Alternative Hypothesis:
The hypothesis states that at least one of the sleep qualities has different mean value in depression and the hypothesis is many-sided.
Decision Rule:
If
If
Conclusion:
The level of significance is,
Here, the P-value is less than the level of significance.
That is,
Hence, there is not sufficient evidence to conclude that differences among the mean lengths are not exist at
Thus, there is a significant difference in the mean of sleep qualities in depression. So, at least one of the sleep qualities has different population mean in depression at 5% level.
b.
To explain: The reason to trust the ANOVA F test to give valid results for the given data.
b.
Explanation of Solution
Justification:
The ANOVA F statistic for I normal population is given as
Where the mean square for groups is,
And the mean square error is,
When
The Analysis of Variance (ANOVA) is a statistical method to test differences between two or more means. The inferences about means are made by analyzing variance.
The test of null hypothesis against alternate hypothesis is called the analysis of variance F test. The test helps in finding whether the null hypothesis is rejected or the alternative hypothesis is accepted. The F-statics and P-values are computed for the result.
In the data all three conditions, that is, poor quality of sleep, optimal quality of sleep and border quality of sleep, are satisfied. The
c.
To explain: The reason of the study is being observational.
To explain: The reason for association not proving causation.
To explain: The poor-quality sleep leading to higher levels of depression.
To explain: The higher depression scores affecting quality of sleep.
c.
Explanation of Solution
Justification:
Observational Study:
An observational study measures the values of a variable without influencing the values of response variables and explanatory variables. Thus, in observational study researchers can observe the behaviors of the individuals without influencing the outcome of that study.
In the observational study, the sleep causation may vary so association does not prove causation. Through causation the students cannot be assigned randomly. The poor-quality sleep may affect the moods, academic performance, physical health, intake of psychoactive drug and thus lead to higher level of depressions. In the Pittsburg Sleep Quality Index (PSQI), students scoring less than or equal to 5 on the index are classified as optimal sleepers, those scoring 6 or 7 are classified as borderline, and those scoring over 7 are classified as poor sleepers. Thus, the poor-quality of sleep leads higher level of depression. In the Profile of Moods State (POMS), the higher scores of index show greater levels of depression.
Want to see more full solutions like this?
Chapter 27 Solutions
The Basic Practice of Statistics

- In a network with 12 links, one of the links has failed. The failed link is randomlylocated. An electrical engineer tests the links one by one until the failed link is found.a. What is the probability that the engineer will find the failed link in the first test?b. What is the probability that the engineer will find the failed link in five tests?Note: You should assume that for Part b, the five tests are done consecutively.arrow_forwardProblem 3. Pricing a multi-stock option the Margrabe formula The purpose of this problem is to price a swap option in a 2-stock model, similarly as what we did in the example in the lectures. We consider a two-dimensional Brownian motion given by W₁ = (W(¹), W(2)) on a probability space (Q, F,P). Two stock prices are modeled by the following equations: dX = dY₁ = X₁ (rdt+ rdt+0₁dW!) (²)), Y₁ (rdt+dW+0zdW!"), with Xo xo and Yo =yo. This corresponds to the multi-stock model studied in class, but with notation (X+, Y₁) instead of (S(1), S(2)). Given the model above, the measure P is already the risk-neutral measure (Both stocks have rate of return r). We write σ = 0₁+0%. We consider a swap option, which gives you the right, at time T, to exchange one share of X for one share of Y. That is, the option has payoff F=(Yr-XT). (a) We first assume that r = 0 (for questions (a)-(f)). Write an explicit expression for the process Xt. Reminder before proceeding to question (b): Girsanov's theorem…arrow_forwardProblem 1. Multi-stock model We consider a 2-stock model similar to the one studied in class. Namely, we consider = S(1) S(2) = S(¹) exp (σ1B(1) + (M1 - 0/1 ) S(²) exp (02B(2) + (H₂- M2 where (B(¹) ) +20 and (B(2) ) +≥o are two Brownian motions, with t≥0 Cov (B(¹), B(2)) = p min{t, s}. " The purpose of this problem is to prove that there indeed exists a 2-dimensional Brownian motion (W+)+20 (W(1), W(2))+20 such that = S(1) S(2) = = S(¹) exp (011W(¹) + (μ₁ - 01/1) t) 롱) S(²) exp (021W (1) + 022W(2) + (112 - 03/01/12) t). where σ11, 21, 22 are constants to be determined (as functions of σ1, σ2, p). Hint: The constants will follow the formulas developed in the lectures. (a) To show existence of (Ŵ+), first write the expression for both W. (¹) and W (2) functions of (B(1), B(²)). as (b) Using the formulas obtained in (a), show that the process (WA) is actually a 2- dimensional standard Brownian motion (i.e. show that each component is normal, with mean 0, variance t, and that their…arrow_forward
- The scores of 8 students on the midterm exam and final exam were as follows. Student Midterm Final Anderson 98 89 Bailey 88 74 Cruz 87 97 DeSana 85 79 Erickson 85 94 Francis 83 71 Gray 74 98 Harris 70 91 Find the value of the (Spearman's) rank correlation coefficient test statistic that would be used to test the claim of no correlation between midterm score and final exam score. Round your answer to 3 places after the decimal point, if necessary. Test statistic: rs =arrow_forwardBusiness discussarrow_forwardBusiness discussarrow_forward
- I just need to know why this is wrong below: What is the test statistic W? W=5 (incorrect) and What is the p-value of this test? (p-value < 0.001-- incorrect) Use the Wilcoxon signed rank test to test the hypothesis that the median number of pages in the statistics books in the library from which the sample was taken is 400. A sample of 12 statistics books have the following numbers of pages pages 127 217 486 132 397 297 396 327 292 256 358 272 What is the sum of the negative ranks (W-)? 75 What is the sum of the positive ranks (W+)? 5What type of test is this? two tailedWhat is the test statistic W? 5 These are the critical values for a 1-tailed Wilcoxon Signed Rank test for n=12 Alpha Level 0.001 0.005 0.01 0.025 0.05 0.1 0.2 Critical Value 75 70 68 64 60 56 50 What is the p-value for this test? p-value < 0.001arrow_forwardons 12. A sociologist hypothesizes that the crime rate is higher in areas with higher poverty rate and lower median income. She col- lects data on the crime rate (crimes per 100,000 residents), the poverty rate (in %), and the median income (in $1,000s) from 41 New England cities. A portion of the regression results is shown in the following table. Standard Coefficients error t stat p-value Intercept -301.62 549.71 -0.55 0.5864 Poverty 53.16 14.22 3.74 0.0006 Income 4.95 8.26 0.60 0.5526 a. b. Are the signs as expected on the slope coefficients? Predict the crime rate in an area with a poverty rate of 20% and a median income of $50,000. 3. Using data from 50 workarrow_forward2. The owner of several used-car dealerships believes that the selling price of a used car can best be predicted using the car's age. He uses data on the recent selling price (in $) and age of 20 used sedans to estimate Price = Po + B₁Age + ε. A portion of the regression results is shown in the accompanying table. Standard Coefficients Intercept 21187.94 Error 733.42 t Stat p-value 28.89 1.56E-16 Age -1208.25 128.95 -9.37 2.41E-08 a. What is the estimate for B₁? Interpret this value. b. What is the sample regression equation? C. Predict the selling price of a 5-year-old sedan.arrow_forward
- ian income of $50,000. erty rate of 13. Using data from 50 workers, a researcher estimates Wage = Bo+B,Education + B₂Experience + B3Age+e, where Wage is the hourly wage rate and Education, Experience, and Age are the years of higher education, the years of experience, and the age of the worker, respectively. A portion of the regression results is shown in the following table. ni ogolloo bash 1 Standard Coefficients error t stat p-value Intercept 7.87 4.09 1.93 0.0603 Education 1.44 0.34 4.24 0.0001 Experience 0.45 0.14 3.16 0.0028 Age -0.01 0.08 -0.14 0.8920 a. Interpret the estimated coefficients for Education and Experience. b. Predict the hourly wage rate for a 30-year-old worker with four years of higher education and three years of experience.arrow_forward1. If a firm spends more on advertising, is it likely to increase sales? Data on annual sales (in $100,000s) and advertising expenditures (in $10,000s) were collected for 20 firms in order to estimate the model Sales = Po + B₁Advertising + ε. A portion of the regression results is shown in the accompanying table. Intercept Advertising Standard Coefficients Error t Stat p-value -7.42 1.46 -5.09 7.66E-05 0.42 0.05 8.70 7.26E-08 a. Interpret the estimated slope coefficient. b. What is the sample regression equation? C. Predict the sales for a firm that spends $500,000 annually on advertising.arrow_forwardCan you help me solve problem 38 with steps im stuck.arrow_forward
 MATLAB: An Introduction with ApplicationsStatisticsISBN:9781119256830Author:Amos GilatPublisher:John Wiley & Sons Inc
 Probability and Statistics for Engineering and th...StatisticsISBN:9781305251809Author:Jay L. DevorePublisher:Cengage Learning
 Statistics for The Behavioral Sciences (MindTap C...StatisticsISBN:9781305504912Author:Frederick J Gravetter, Larry B. WallnauPublisher:Cengage Learning
 Elementary Statistics: Picturing the World (7th E...StatisticsISBN:9780134683416Author:Ron Larson, Betsy FarberPublisher:PEARSON
 The Basic Practice of StatisticsStatisticsISBN:9781319042578Author:David S. Moore, William I. Notz, Michael A. FlignerPublisher:W. H. Freeman
 Introduction to the Practice of StatisticsStatisticsISBN:9781319013387Author:David S. Moore, George P. McCabe, Bruce A. CraigPublisher:W. H. Freeman