
Identify the effect of the events on the quantity of real
Explanation of Solution
- The U.S firm move their call handling, IT, and data function to Country I:
A movement of call handling, IT, and data function from the U.D firm to Country I’s firm will cause an expansion of a business. In order to expand the business of the firm, it will result in demanding new capital, increase employment, and production. Therefore, the quantity of real GDP supplies and aggregate supply will increase.
Figure -1 shows the effect of movement of business from one firm to other firms as follows:
In Figure -1, the horizontal axis measures real GDP and the vertical axis measures
In Figure -1, the curve short-run aggregate supply (SAS), long-run
- Fuel price rise:
A rise in fuel price will result in an increase in the price level, which will rise the cost of production and temporarily decrease the aggregate supply. This will cause the short-run supply shift to the leftward direction and long-run aggregate supply curve remain unchanged.
Figure -2 shows the impact of rising in fuel price as follows:

In Figure -2, the horizontal axis measures real GDP and the vertical axis measures price level.
In Figure -2, point E represents the initial equilibrium of the economy. Since as the rise in price cause a temporary decrease in short-run aggregate supply, which result in short-run aggregate supply curve shift to the leftward direction. Therefore, point E1 represents the new equilibrium point and SAS1 is the new short-run aggregate supply curve.
- Walmart and Starbucks open in Country I:
The Walmart and Starbucks open in Country I, which causes an expansion of their business. In order to expend the business of the firm, which will result in demanding new capital, increased employment, and production. Therefore, the quantity of real GDP supplies and aggregate supply will increase.
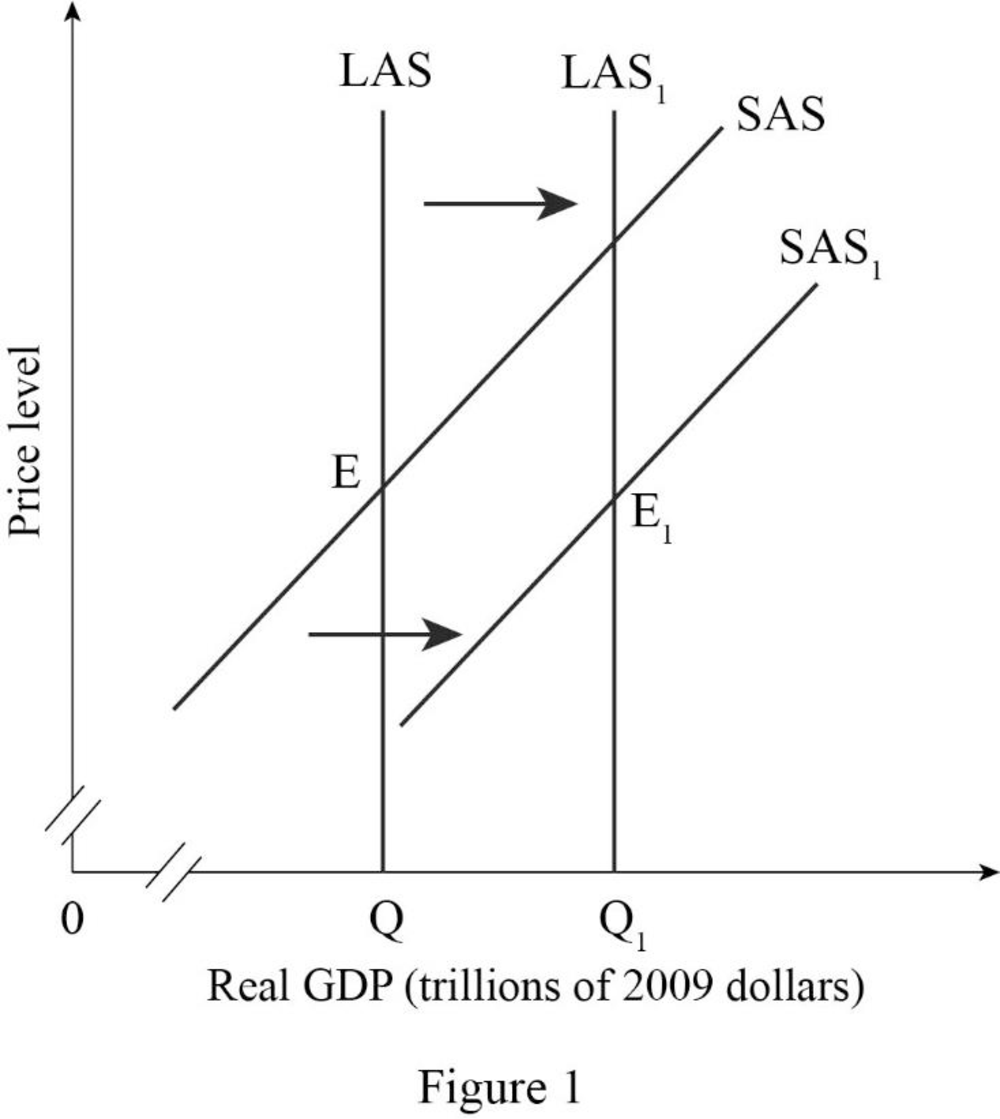
Figure -3 shows the effect of the expansion of business from one country to another country as follows:

In Figure -3, the horizontal axis measures real GDP and the vertical axis measures price level.
In Figure -3, the curve short-run aggregate supply (SAS), long-run aggregate supply curve (LAS) at output Q represents the initial outcome of the economy. The result of the expansion of a business into one country to another country will cause an increase in long-run aggregate supply and short run aggregate supply and will result in a long-run aggregate supply curve (LAS1) and short-run aggregate supply curve (SAS1) shift to the rightward direction.
- Universities in the Country I increase the number of engineering graduates.
An increase in the number of engineering graduates in Country I will result in an increase in human capital and opportunity of employment expansion. Therefore, the quantity of real GDP supplies and aggregate supply will increase.
Figure -4 shows the effect of expansion of business from one country to another country as follows:

In Figure -4, the horizontal axis measures real GDP and the vertical axis measures price level.
In Figure -4, the curve short-run aggregate supply (SAS), long-run aggregate supply curve (LAS) at output Q represents the initial outcome of the economy. The result of an increase in the human capital and employment opportunity will cause an increase in long-run aggregate supply and short-run aggregate supply, which will result in a long-run aggregate supply curve (LAS1) and short-run aggregate supply curve (SAS1) shift to the rightward direction.
- The money wage rate rises:
An increase in the money wage rate causes an increase in the cost of production of the firm because with the existing employment rate, the firm will pay a high salary or wage for the same quantity of output. Therefore, there occur a temporarily decrease in the aggregate supply, which will cause the short-run supply to shift to the leftward direction and long-run aggregate supply curve remain unchanged.
Figure -5 shows the effect of a rise in the money wage rate as follows:
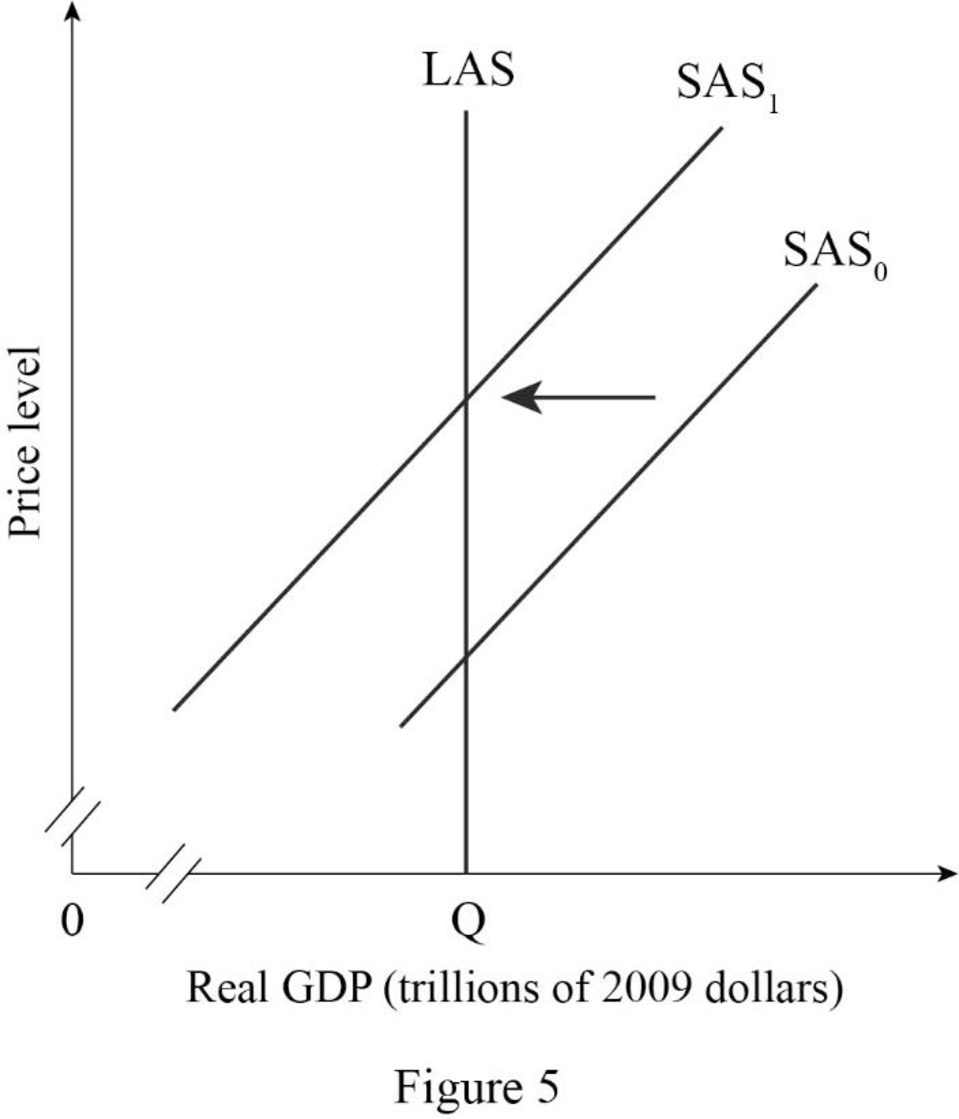
In Figure -5, the horizontal axis measures real GDP and the vertical axis measures price level.
In Figure -5, point E represents the initial equilibrium of the economy. Since as a rise in money wage rate causes a temporary decrease in short-run aggregate supply, which results in short-run aggregate supply curve shift to the leftward direction. Therefore, point E1 represents new equilibrium point and SAS1 is the new short-run aggregate supply curve.
- The price level in Country I increases:
In the short-run, an increase in the price level in the Country I cause an increase in the quantity supply of real GDP. Since an increase in price level causes an increase in the money wage rate, hence, in the long run, there occur an upward movement or real GDP along with long-run aggregate supply curve.
Figure -6 shows the impact of rise in the price level in Country I as follows:
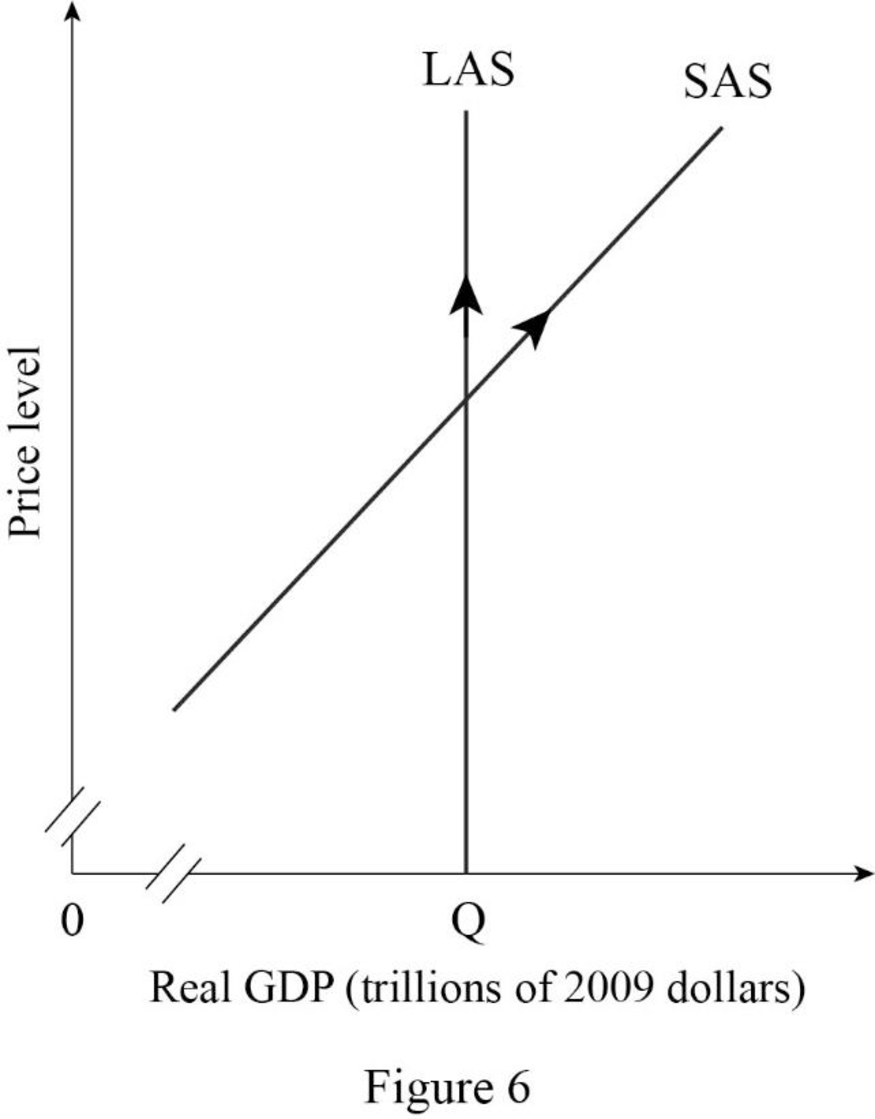
In Figure -6, the horizontal axis measures real GDP and the vertical axis measures price level.
In Figure -6, a rising in the price level causes a rise in money wage rate, hence in the long-run, the quantity supplied of real GDP increases. Therefore, there occurs an upward movement along with the long-run aggregate supply curve and the short-run aggregate supply curve.
Want to see more full solutions like this?
Chapter 27 Solutions
Pearson eText Economics -- Instant Access (Pearson+)

- Answerarrow_forwardM” method Given the following model, solve by the method of “M”. (see image)arrow_forwardAs indicated in the attached image, U.S. earnings for high- and low-skill workers as measured by educational attainment began diverging in the 1980s. The remaining questions in this problem set use the model for the labor market developed in class to walk through potential explanations for this trend. 1. Assume that there are just two types of workers, low- and high-skill. As a result, there are two labor markets: supply and demand for low-skill workers and supply and demand for high-skill workers. Using two carefully drawn labor-market figures, show that an increase in the demand for high skill workers can explain an increase in the relative wage of high-skill workers. 2. Using the same assumptions as in the previous question, use two carefully drawn labor-market figures to show that an increase in the supply of low-skill workers can explain an increase in the relative wage of high-skill workers.arrow_forward
- Published in 1980, the book Free to Choose discusses how economists Milton Friedman and Rose Friedman proposed a one-sided view of the benefits of a voucher system. However, there are other economists who disagree about the potential effects of a voucher system.arrow_forwardThe following diagram illustrates the demand and marginal revenue curves facing a monopoly in an industry with no economies or diseconomies of scale. In the short and long run, MC = ATC. a. Calculate the values of profit, consumer surplus, and deadweight loss, and illustrate these on the graph. b. Repeat the calculations in part a, but now assume the monopoly is able to practice perfect price discrimination.arrow_forwardThe projects under the 'Build, Build, Build' program: how these projects improve connectivity and ease of doing business in the Philippines?arrow_forward

 Macroeconomics: Private and Public Choice (MindTa...EconomicsISBN:9781305506756Author:James D. Gwartney, Richard L. Stroup, Russell S. Sobel, David A. MacphersonPublisher:Cengage Learning
 Economics: Private and Public Choice (MindTap Cou...EconomicsISBN:9781305506725Author:James D. Gwartney, Richard L. Stroup, Russell S. Sobel, David A. MacphersonPublisher:Cengage Learning
 Exploring EconomicsEconomicsISBN:9781544336329Author:Robert L. SextonPublisher:SAGE Publications, Inc
 Economics (MindTap Course List)EconomicsISBN:9781337617383Author:Roger A. ArnoldPublisher:Cengage Learning