
(a)
To explain:
The effect of an increase in government purchase in the short run on the given two diagrams.
Answer to Problem 1P
The effect of an increase in government purchase is shown on the diagrams below:
Explanation of Solution
Government purchase is a part of aggregate
Government purchase:
The goods and services bought by the government to undertake infrastructural developments and other developmental activities is referred as government purchase.
(b)
To explain:
The effect of reduced growth rate of money supply in the short run on the given two diagrams.
Answer to Problem 1P
The effect of decrease in growth rate of money supply is shown on the diagrams below:
Explanation of Solution
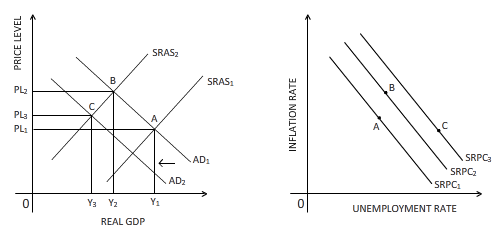
A reduction in the growth rate of money supply affects the aggregate demand negatively through the real balance effect. This leads to a leftward shift of the aggregate demand curve from AD1 to AD2. The new equilibrium point is established at point C, where both real GDP and price level are lower than that of the equilibrium point at B. Due to fall in real GDP, there will be rise in unemployment, and hence the SRPC line shifts rightward from SRPC2 to SRPC3. The new equilibrium point C is shown on the SRPC3 in the right-hand side diagram.
Money supply:
The amount of money in the form of currency and other financial liquid instruments supplied in an economy over a specific time period is referred as money supply.
(c)
To explain:
The effect of an expected higher inflation in the short run on the given two diagrams.
Answer to Problem 1P
The effect of an expected higher inflation is shown on the diagrams below:

Explanation of Solution
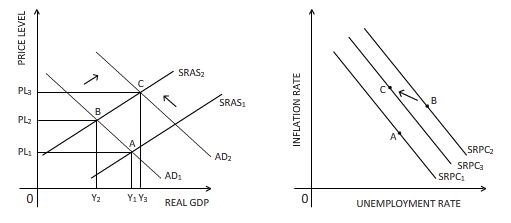
If people expect that higher inflation is approaching, they will increase their consumption expenditure to ward off the high inflation. Therefore, the aggregate demand will rise in the short run. This is reflected in the rightward shift of the aggregate demand curve from AD1 to AD2 in the above diagram. This results in a new equilibrium point C in the diagram where both real GDP and price level are higher than that of point B. On the right-hand side diagram, the SRPC line shifts from SRPC2 to SRPC3 because as real GDP grows at each level of inflation rate, unemployment falls. The new equilibrium point C is marked on SRPC3 line.
Inflation rate:
The rate at which the price level of an economy rises is termed as the rate of inflation. An increased inflation rate decreases the
(d)
To explain:
The effect of a favorable supply shock on the given two diagrams.
Answer to Problem 1P
The effect of supply shock is shown on the diagrams below:
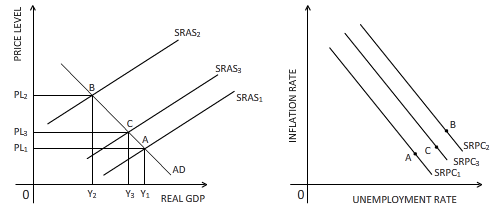
Explanation of Solution
A favorable supply shock will push the supply of the economy upward, causing the
Supply shock:
An event which leads to a sudden rise or fall in the supply of goods and services is referred as supply shock.
Want to see more full solutions like this?

- 1. We want to examine the comparative statics of the Black Scholes model. Complete the following table using the Excel model from class or another of your choice. Provide the call premium and the put premium for each scenario. Underlier Risk-free Scenario price rate Volatility Time to expiration Strike Call premium Put premium Baseline $50 5% 25% 1 year $55 Higher strike $50 5% 25% 1 year $60 Higher volatility $50 5% 40% 1 year $55 Higher risk free $50 8% 25% 1 year $55 More time $50 5% 25% 2 years $55 2. Look at the baseline scenario. a. What is the probability that the call is exercised in the baseline scenario? b. What is the probability that the put is exercised? c. Explain why the probabilities sum to 1.arrow_forwardSome people say that since inflation can be reduced in the long run without an increase in unemployment, we should reduce inflation to zero. Others believe that a steady rate of inflation at, say, 3 percent, should be our goal. What are the pros and cons of these two arguments? What, in your opinion, are good long-run goals for reducing inflation and unemployment?arrow_forwardExplain in words how investment multiplier and the interest sensitivity of aggregate demand affect the slope of the IS curve. Explain in words how and why the income and interest sensitivities of the demand for real balances affect the slope of the LM curve. According to the IS–LM model, what happens to the interest rate, income, consumption, and investment under the following circumstances?a. The central bank increases the money supply.b. The government increases government purchases.c. The government increases taxes.arrow_forward
- Suppose that a person’s wealth is $50,000 and that her yearlyincome is $60,000. Also suppose that her money demand functionis given by Md = $Y10.35 - i2Derive the demand for bonds. Suppose the interest rate increases by 10 percentage points. What is the effect on her demand for bonds?b. What are the effects of an increase in income on her demand for money and her demand for bonds? Explain in wordsarrow_forwardImagine you are a world leader and you just viewed this presentation as part of the United Nations Sustainable Development Goal Meeting. Summarize your findings https://www.youtube.com/watch?v=v7WUpgPZzpIarrow_forwardPlease draw a standard Commercial Bank Balance Sheet and briefly explain each of the main components.arrow_forward
- Please draw the Federal Reserve System’s Balance Sheet and briefly explain each of the main components.arrow_forward19. In a paragraph, no bullet, points please answer the question and follow the instructions. Give only the solution: Use the Feynman technique throughout. Assume that you’re explaining the answer to someone who doesn’t know the topic at all. How does the Federal Reserve currently get the federal funds rate where they want it to be?arrow_forward18. In a paragraph, no bullet, points please answer the question and follow the instructions. Give only the solution: Use the Feynman technique throughout. Assume that you’re explaining the answer to someone who doesn’t know the topic at all. Carefully compare and contrast fiscal policy and monetary policy.arrow_forward
- 15. In a paragraph, no bullet, points please answer the question and follow the instructions. Give only the solution: Use the Feynman technique throughout. Assume that you’re explaining the answer to someone who doesn’t know the topic at all. What are the common arguments for and against high levels of federal debt?arrow_forward17. In a paragraph, no bullet, points please answer the question and follow the instructions. Give only the solution: Use the Feynman technique throughout. Assume that you’re explaining the answer to someone who doesn’t know the topic at all. Explain the difference between present value and future value. Be sure to use and explain the mathematical formulas for both. How does one interpret these formulas?arrow_forward12. Give the solution: Use the Feynman technique throughout. Assume that you’re explaining the answer to someone who doesn’t know the topic at all. Show and carefully explain the Taylor rule and all of its components, used as a monetary policy guide.arrow_forward

 Economics (MindTap Course List)EconomicsISBN:9781337617383Author:Roger A. ArnoldPublisher:Cengage Learning
 Exploring EconomicsEconomicsISBN:9781544336329Author:Robert L. SextonPublisher:SAGE Publications, Inc
 Principles of Economics (MindTap Course List)EconomicsISBN:9781305585126Author:N. Gregory MankiwPublisher:Cengage Learning