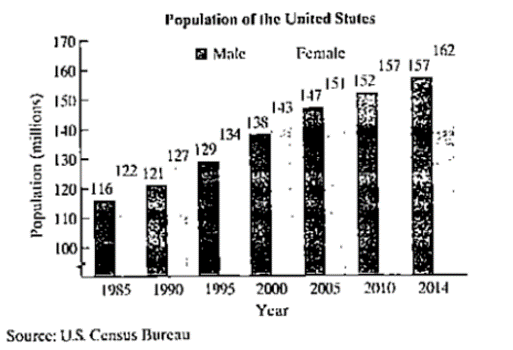
The bar graph shows the population of the United States in millions for seven selected years. Here are two functions that model the data: M ( x ) = 1.48 x + 115.1 Male U .S .pepolalias, M ( x ) , is aillises, x y e a r a f t e r 1985 F ( x ) = 1.44 x + 120.9 Female U .S .pepolalias, F ( x ) , is aillises, x y e a r a f t e r 1985 Use the functions to solve Exercises 97-98. a. Write a function that models the total U.S. population for the years shown in the bar graph. b. Use the function from part (a) to find the total U.S. population in 2010. c. How well does the result in part (b) model the actual total U.S. population in 2010 shown by the bar graph?
The bar graph shows the population of the United States in millions for seven selected years. Here are two functions that model the data: M ( x ) = 1.48 x + 115.1 Male U .S .pepolalias, M ( x ) , is aillises, x y e a r a f t e r 1985 F ( x ) = 1.44 x + 120.9 Female U .S .pepolalias, F ( x ) , is aillises, x y e a r a f t e r 1985 Use the functions to solve Exercises 97-98. a. Write a function that models the total U.S. population for the years shown in the bar graph. b. Use the function from part (a) to find the total U.S. population in 2010. c. How well does the result in part (b) model the actual total U.S. population in 2010 shown by the bar graph?
Solution Summary: The author calculates the total US population from the function of G(x)=2.92x+236.
The bar graph shows the population of the United States in millions for seven selected years.
Here are two functions that model the data:
M
(
x
)
=
1.48
x
+
115.1
Male
U
.S
.pepolalias,
M
(
x
)
,
is aillises,
x
y
e
a
r
a
f
t
e
r
1985
F
(
x
)
=
1.44
x
+
120.9
Female
U
.S
.pepolalias,
F
(
x
)
,
is aillises,
x
y
e
a
r
a
f
t
e
r
1985
Use the functions to solve Exercises 97-98.
a. Write a function that models the total U.S. population for the years shown in the bar graph.
b. Use the function from part (a) to find the total U.S. population in 2010.
c. How well does the result in part (b) model the actual total U.S. population in 2010 shown by the bar graph?
For each graph below, state whether it represents a function.
Graph 1
24y
Graph 2
Graph 3
4
2
-8
-6 -4
-2
-2
2 4 6
Function?
○ Yes
○ No
○ Yes
○ No
Graph 4
Graph 5
8
Function?
Yes
No
Yes
No
-2.
○ Yes
○ No
Graph 6
4
+
2
4
-8 -6 -4 -2
2 4 6
8
Yes
-4++
No
Practice
k Help
ises
A
96
Anewer The probability that you get a sum of at least 10 is
Determine the number of ways that the specified event can occur when
two number cubes are rolled.
1. Getting a sum of 9 or 10
3. Getting a sum less than 5
2. Getting a sum of 6 or 7
4. Getting a sum that is odd
Tell whether you would use the addition principle or the multiplication
principle to determine the total number of possible outcomes for the
situation described.
5. Rolling three number cubes
6. Getting a sum of 10 or 12 after rolling three number cubes
A set of playing cards contains four groups of cards designated by color
(black, red, yellow, and green) with cards numbered from 1 to 14 in each
group. Determine the number of ways that the specified event can occur
when a card is drawn from the set.
7. Drawing a 13 or 14
9. Drawing a number less than 4
8. Drawing a yellow or green card
10. Drawing a black, red, or green car
The spinner is divided into equal parts.
Find the specified…
Need a deep-dive on the concept behind this application? Look no further. Learn more about this topic, algebra and related others by exploring similar questions and additional content below.


 Glencoe Algebra 1, Student Edition, 9780079039897...AlgebraISBN:9780079039897Author:CarterPublisher:McGraw Hill
 Algebra & Trigonometry with Analytic GeometryAlgebraISBN:9781133382119Author:SwokowskiPublisher:Cengage
 Big Ideas Math A Bridge To Success Algebra 1: Stu...AlgebraISBN:9781680331141Author:HOUGHTON MIFFLIN HARCOURTPublisher:Houghton Mifflin Harcourt
 Algebra and Trigonometry (MindTap Course List)AlgebraISBN:9781305071742Author:James Stewart, Lothar Redlin, Saleem WatsonPublisher:Cengage Learning
 College AlgebraAlgebraISBN:9781305115545Author:James Stewart, Lothar Redlin, Saleem WatsonPublisher:Cengage Learning