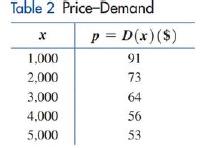
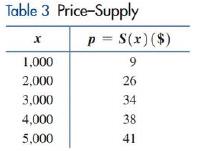
Supply and demand. A cordless screwdriver is sold through a national chain of discount stores. A marketing company established price-demand and price-supply tables (Tables 2 and 3 ), where x is the number of screwdrivers people are willing to buy and the store is willing to sell each month at a price of p dollars per screwdriver. (A) Find a logarithmic regression model y = a + b ln x for the data in Table 2 . Estimate the demand (to the nearest unit) at a price level of $ 50 . (B) Find a logarithmic regression model y = a + b ln x for the data in Table 3 . Estimate the supply (to the nearest unit) at a price level of $50 . (C) Does a price level of $50 represent a stable condition, or is the price likely to increase or decrease? Explain.
Supply and demand. A cordless screwdriver is sold through a national chain of discount stores. A marketing company established price-demand and price-supply tables (Tables 2 and 3 ), where x is the number of screwdrivers people are willing to buy and the store is willing to sell each month at a price of p dollars per screwdriver. (A) Find a logarithmic regression model y = a + b ln x for the data in Table 2 . Estimate the demand (to the nearest unit) at a price level of $ 50 . (B) Find a logarithmic regression model y = a + b ln x for the data in Table 3 . Estimate the supply (to the nearest unit) at a price level of $50 . (C) Does a price level of $50 represent a stable condition, or is the price likely to increase or decrease? Explain.
Supply and demand. A cordless screwdriver is sold through a national chain of discount stores. A marketing company established price-demand and price-supply tables (Tables
2
and
3
), where
x
is the number of screwdrivers people are willing to buy and the store is willing to sell each month at a price of
p
dollars per screwdriver.
(A) Find a logarithmic regression model
y
=
a
+
b
ln
x
for the data in Table
2
. Estimate the demand (to the nearest unit) at a price level of
$
50
.
(B) Find a logarithmic regression model
y
=
a
+
b
ln
x
for the data in Table
3
. Estimate the supply (to the nearest unit) at a price level of
$50
.
(C) Does a price level of
$50
represent a stable condition, or is the price likely to increase or decrease? Explain.
College Algebra with Modeling & Visualization (5th Edition)
Knowledge Booster
Learn more about
Need a deep-dive on the concept behind this application? Look no further. Learn more about this topic, subject and related others by exploring similar questions and additional content below.
Correlation Vs Regression: Difference Between them with definition & Comparison Chart; Author: Key Differences;https://www.youtube.com/watch?v=Ou2QGSJVd0U;License: Standard YouTube License, CC-BY
Correlation and Regression: Concepts with Illustrative examples; Author: LEARN & APPLY : Lean and Six Sigma;https://www.youtube.com/watch?v=xTpHD5WLuoA;License: Standard YouTube License, CC-BY


 Glencoe Algebra 1, Student Edition, 9780079039897...AlgebraISBN:9780079039897Author:CarterPublisher:McGraw Hill
 Functions and Change: A Modeling Approach to Coll...AlgebraISBN:9781337111348Author:Bruce Crauder, Benny Evans, Alan NoellPublisher:Cengage Learning
 Algebra and Trigonometry (MindTap Course List)AlgebraISBN:9781305071742Author:James Stewart, Lothar Redlin, Saleem WatsonPublisher:Cengage Learning
 Algebra & Trigonometry with Analytic GeometryAlgebraISBN:9781133382119Author:SwokowskiPublisher:Cengage
 College AlgebraAlgebraISBN:9781305115545Author:James Stewart, Lothar Redlin, Saleem WatsonPublisher:Cengage Learning