
Videos
To solve: the system of given inequalities by graphing and name the coordinates of the vertices of the polygonal convex set.
Answer to Problem 5CFU
| Inequality | ||||
| Coordinate Name | x-axis | Between orange | Below Blue line | Below green line |
Explanation of Solution
Given information:
Calculation:
After rearranging third and fourth inequalities in terms of y , we get
Graph for the given inequalities is shown below.
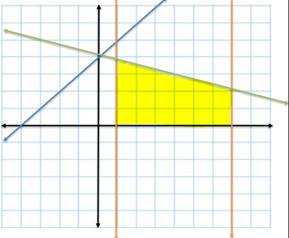
Notice that inequality (3) is almost irrelevant to the solution because all points that solve it also solve the inequality (4).
Thus, the coordinate name for the vertices of the
| Inequality | ||||
| Coordinate Name | x-axis | Between orange | Below Blue line | Below green line |
Chapter 2 Solutions
Advanced Mathematical Concepts: Precalculus with Applications, Student Edition
Additional Math Textbook Solutions
Calculus: Early Transcendentals (2nd Edition)
Introductory Statistics
Basic Business Statistics, Student Value Edition
Elementary Statistics (13th Edition)
University Calculus: Early Transcendentals (4th Edition)
Elementary Statistics: Picturing the World (7th Edition)


- Explain the conditions under which the Radius of Convergence of the Power Series is a "finite positive real number" r>0arrow_forwardThis means that when the Radius of Convergence of the Power Series is a "finite positive real number" r>0, then every point x of the Power Series on (-r, r) will absolutely converge (x ∈ (-r, r)). Moreover, every point x on the Power Series (-∞, -r)U(r, +∞) will diverge (|x| >r). Please explain it.arrow_forwardExplain the conditions under which Radious of Convergence of Power Series is infinite. Explain what will happen?arrow_forward
- Explain the conditions under Radius of Convergence which of Power Series is 0arrow_forwardExplain the key points and reasons for 12.8.2 (1) and 12.8.2 (2)arrow_forwardQ1: A slider in a machine moves along a fixed straight rod. Its distance x cm along the rod is given below for various values of the time. Find the velocity and acceleration of the slider when t = 0.3 seconds. t(seconds) x(cm) 0 0.1 0.2 0.3 0.4 0.5 0.6 30.13 31.62 32.87 33.64 33.95 33.81 33.24 Q2: Using the Runge-Kutta method of fourth order, solve for y atr = 1.2, From dy_2xy +et = dx x²+xc* Take h=0.2. given x = 1, y = 0 Q3:Approximate the solution of the following equation using finite difference method. ly -(1-y= y = x), y(1) = 2 and y(3) = −1 On the interval (1≤x≤3).(taking h=0.5).arrow_forward
- Consider the function f(x) = x²-1. (a) Find the instantaneous rate of change of f(x) at x=1 using the definition of the derivative. Show all your steps clearly. (b) Sketch the graph of f(x) around x = 1. Draw the secant line passing through the points on the graph where x 1 and x-> 1+h (for a small positive value of h, illustrate conceptually). Then, draw the tangent line to the graph at x=1. Explain how the slope of the tangent line relates to the value you found in part (a). (c) In a few sentences, explain what the instantaneous rate of change of f(x) at x = 1 represents in the context of the graph of f(x). How does the rate of change of this function vary at different points?arrow_forward1. The graph of ƒ is given. Use the graph to evaluate each of the following values. If a value does not exist, state that fact. и (a) f'(-5) (b) f'(-3) (c) f'(0) (d) f'(5) 2. Find an equation of the tangent line to the graph of y = g(x) at x = 5 if g(5) = −3 and g'(5) = 4. - 3. If an equation of the tangent line to the graph of y = f(x) at the point where x 2 is y = 4x — 5, find ƒ(2) and f'(2).arrow_forwardDoes the series converge or divergearrow_forward
 Calculus: Early TranscendentalsCalculusISBN:9781285741550Author:James StewartPublisher:Cengage Learning
 Thomas' Calculus (14th Edition)CalculusISBN:9780134438986Author:Joel R. Hass, Christopher E. Heil, Maurice D. WeirPublisher:PEARSON
 Calculus: Early Transcendentals (3rd Edition)CalculusISBN:9780134763644Author:William L. Briggs, Lyle Cochran, Bernard Gillett, Eric SchulzPublisher:PEARSON
 Calculus: Early TranscendentalsCalculusISBN:9781319050740Author:Jon Rogawski, Colin Adams, Robert FranzosaPublisher:W. H. Freeman
 Calculus: Early Transcendental FunctionsCalculusISBN:9781337552516Author:Ron Larson, Bruce H. EdwardsPublisher:Cengage Learning