Concept explainers
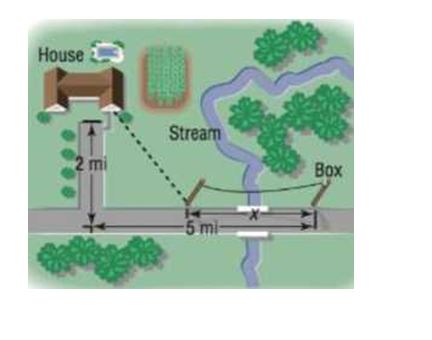
22. Installing Cable TV MetroMedia Cable is asked to provide service to a customer whose house is located 2 miles from the road along which the cable is buried. The nearest connection box for the cable is located 5 miles down the road. See the figure.

(a) If the installation cost is S500 per mile along the road and per mile off the road, build a model that expresses the total cost C of installation as a function of the distance x (in miles) from the connection box to the point where the cable installation turns off the road. Find the domain of .
(b) Compute the cost if mile.
(c) Compute the cost if miles.
(d) Graph the function . Use TRACE to see how the cost C varies as x changes from 0 to 5.
(e) What value of x results in the least cost?
Want to see the full answer?
Check out a sample textbook solution
Chapter 2 Solutions
EBK PEARSON ETEXT PRECALCULUS -- ACCESS
Additional Math Textbook Solutions
A First Course in Probability (10th Edition)
Calculus: Early Transcendentals (2nd Edition)
College Algebra (7th Edition)
Elementary Statistics
A Problem Solving Approach To Mathematics For Elementary School Teachers (13th Edition)
- Please help me with this question as I want to know how can I perform the partial fraction decompostion on this alebgric equation to find the time-domain of y(t)arrow_forwardPlease help me with this question as I want to know how can I perform the partial fraction on this alebgric equation to find the time-domain of y(t)arrow_forwardEvaluate F³ - dr where ♬ = (4z, -4y, x), and C' is given by (t) = (sin(t), t, cos(t)), 0≤t≤ñ .arrow_forward
- Mid-Term Review Find the formula for (f + g)(x). f(x) = x² - 10x + 25 and g(x) = x² - 10x + 24 (f + g) (x) = [ 2 ]x² X + DELL Skip Sarrow_forwardCalculus III May I please have some elaborations on Example 2 part a? Thank you.arrow_forward1. A bicyclist is riding their bike along the Chicago Lakefront Trail. The velocity (in feet per second) of the bicyclist is recorded below. Use (a) Simpson's Rule, and (b) the Trapezoidal Rule to estimate the total distance the bicyclist traveled during the 8-second period. t 0 2 4 6 8 V 10 15 12 10 16 2. Find the midpoint rule approximation for (a) n = 4 +5 x²dx using n subintervals. 1° 2 (b) n = 8 36 32 28 36 32 28 24 24 20 20 16 16 12 8- 4 1 2 3 4 5 6 12 8 4 1 2 3 4 5 6arrow_forward
- = 5 37 A 4 8 0.5 06 9arrow_forwardConsider the following system of equations, Ax=b : x+2y+3z - w = 2 2x4z2w = 3 -x+6y+17z7w = 0 -9x-2y+13z7w = -14 a. Find the solution to the system. Write it as a parametric equation. You can use a computer to do the row reduction. b. What is a geometric description of the solution? Explain how you know. c. Write the solution in vector form? d. What is the solution to the homogeneous system, Ax=0?arrow_forward2. Find a matrix A with the following qualities a. A is 3 x 3. b. The matrix A is not lower triangular and is not upper triangular. c. At least one value in each row is not a 1, 2,-1, -2, or 0 d. A is invertible.arrow_forward
- Algebra & Trigonometry with Analytic GeometryAlgebraISBN:9781133382119Author:SwokowskiPublisher:Cengage


 Trigonometry (MindTap Course List)TrigonometryISBN:9781337278461Author:Ron LarsonPublisher:Cengage Learning
 Glencoe Algebra 1, Student Edition, 9780079039897...AlgebraISBN:9780079039897Author:CarterPublisher:McGraw Hill
 College AlgebraAlgebraISBN:9781305115545Author:James Stewart, Lothar Redlin, Saleem WatsonPublisher:Cengage Learning


