Human Physiology: An Integrated Approach (7th Edition)
7th Edition
ISBN: 9780321981226
Author: Dee Unglaub Silverthorn
Publisher: PEARSON
expand_more
expand_more
format_list_bulleted
Textbook Question
Chapter 26, Problem 21RQ
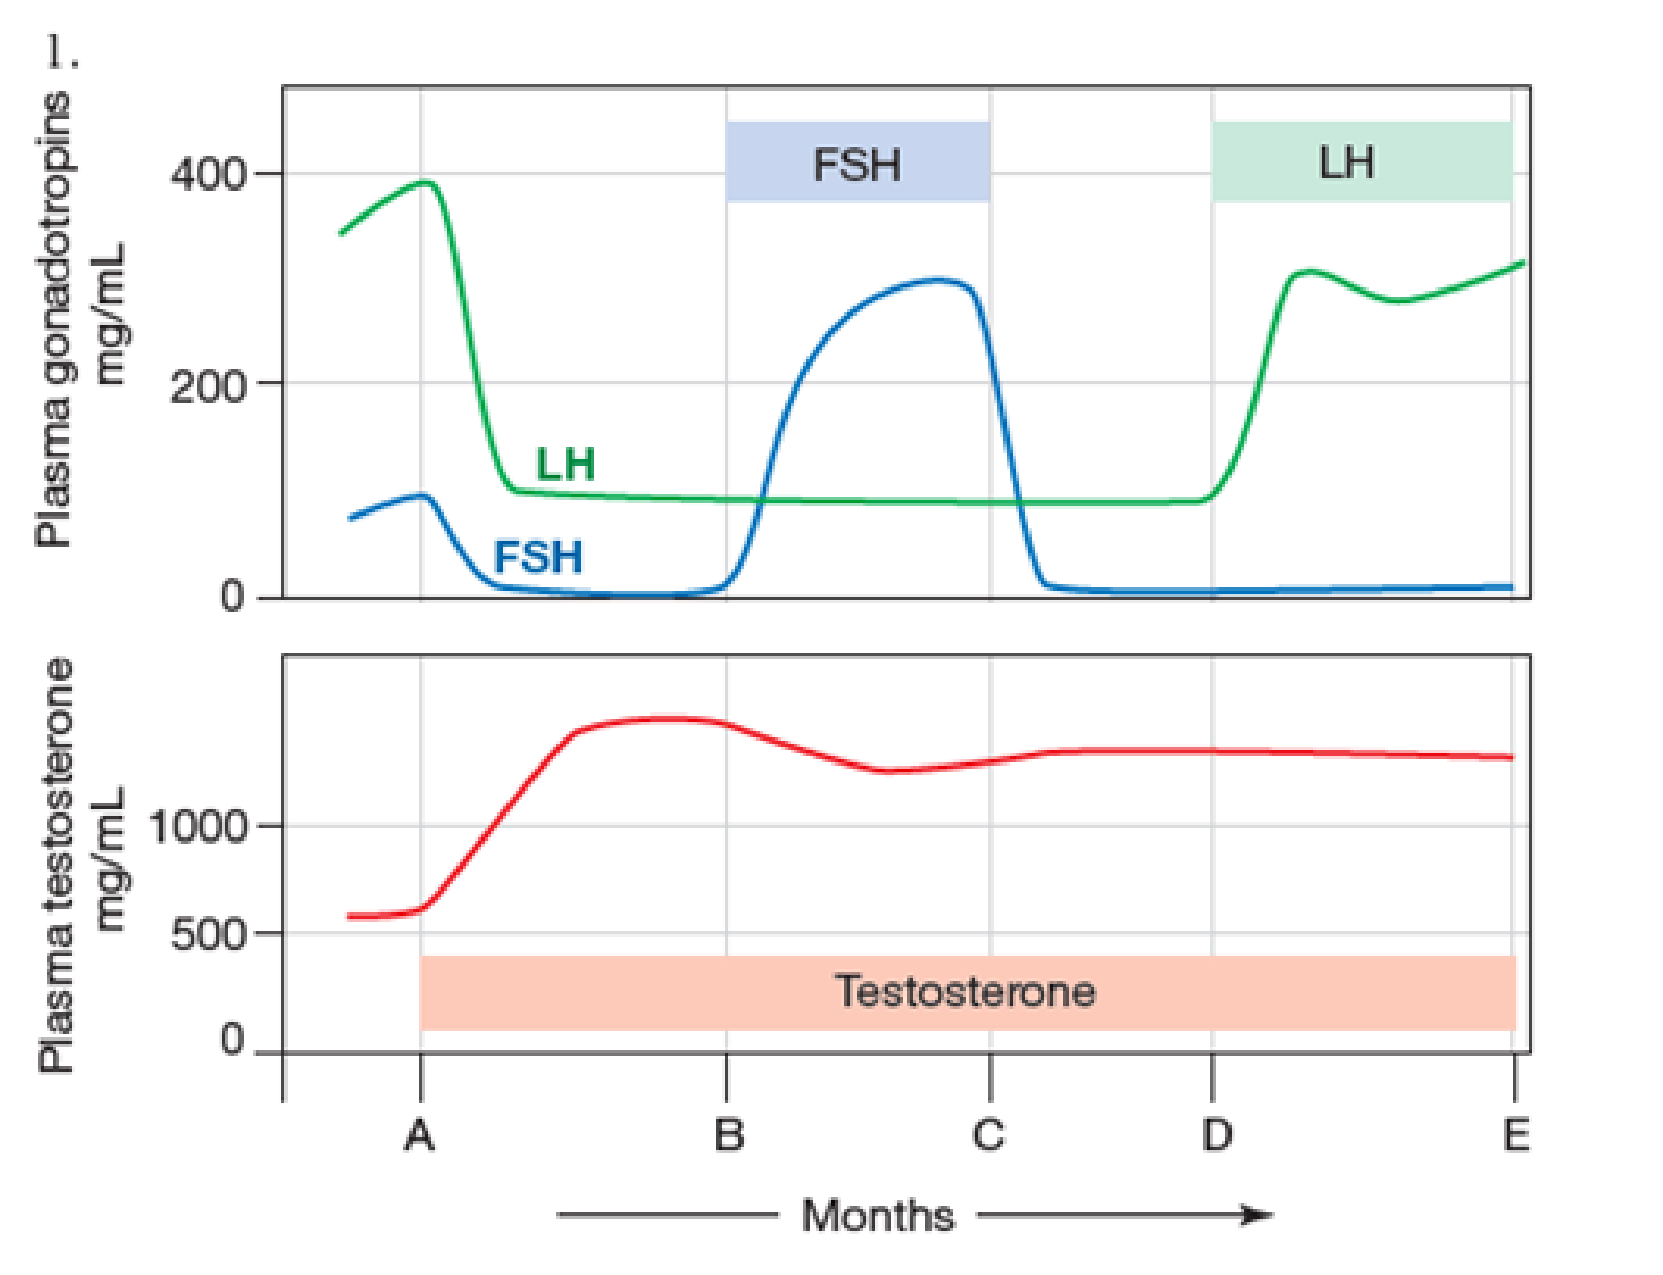
The following graph shows the results of an experiment in which normal men were given testosterone over a period of months (indicated by the bar from A to E). Control values of hormones were measured prior to the start of the experiment. From time B to time C, the men were also given FSH. From time D to time E, they were also given LH. Based on the information given, answer the following questions.

- (a) Why did testosterone level increase beginning at point A?
- (b) Why did LH and FSH levels decrease beginning at point A?
- (c) Predict what happened to the men’s sperm production in the A–B interval, the B–C interval, and the D–E interval.
Expert Solution & Answer
Want to see the full answer?
Check out a sample textbook solution
Students have asked these similar questions
Do cats fly without wings ?
Luke recently moved to a new apartment and wants to grow houseplants but isn't sure which room will be the best fit for them. Apply your knowledge of the scientific method to recommend a strategy for Luke to follow when determining the ideal location for houseplants in his new apartment.
A farmer has noticed that his soybean plants produce more beans in some years than others. He claims to always apply the same amount of fertilizer to the plants, but he suspects the difference in crop yield may have something to do with the amount of water the crops receive. The farmer has observed that the soybeans on his farm usually receive between 0 to 0.5 inches of water per day, but he is unsure of the optimal average daily amount of water with which to irrigate.
1. State a question that addresses the farmer’s problem
2. Conduct online research on “soybean crop irrigation" and record a brief summary of the findings
3. Construct a testable hypothesis and record i
4. Design an experiment to test the hypothesis and describe the procedures, variables, and data to be collected
5. What is the purpose of a control group in an experiment? What would the control groups be for each of your designed experiments in this exercise?
6. Describe the data that would be recorded in each of the…
Chapter 26 Solutions
Human Physiology: An Integrated Approach (7th Edition)
Ch. 26 - Name the male and female gonads and gametes.Ch. 26 - Where in a target cell would you expect to find...Ch. 26 - Prob. 3CCCh. 26 - Which sex will a zygote become if it inherits only...Ch. 26 - If the testes are removed from an early male...Ch. 26 - The gametes in a newborn male are at what stage of...Ch. 26 - Compare the amount of DNA in the first polar body...Ch. 26 - How many gametes are formed from one primary...Ch. 26 - Prob. 9CCCh. 26 - Prob. 10CC
Ch. 26 - Prob. 11CCCh. 26 - What do Sertoli cells secrete? What do...Ch. 26 - Prob. 13CCCh. 26 - Which cells of the testes have receptors for FSH?...Ch. 26 - Prob. 15CCCh. 26 - Name the phases of the ovarian cycle and the...Ch. 26 - Prob. 17CCCh. 26 - Prob. 18CCCh. 26 - On what day of the menstrual cycle will a woman...Ch. 26 - Match each of the following items with all the...Ch. 26 - The Y chromosome contains a region for male sex...Ch. 26 - List the functions of the gonads. How do the...Ch. 26 - Define each of the following terms and describe...Ch. 26 - Trace the anatomical routes to the external...Ch. 26 - Prob. 6RQCh. 26 - Prob. 7RQCh. 26 - List and give a specific example of the various...Ch. 26 - Prob. 9RQCh. 26 - Prob. 10RQCh. 26 - Diagram the menstrual cycle, distinguishing...Ch. 26 - Prob. 12RQCh. 26 - Define and relate each of the following terms in...Ch. 26 - Compare the actions of each of the following...Ch. 26 - Prob. 15RQCh. 26 - Discuss the roles of each of the following...Ch. 26 - Prob. 17RQCh. 26 - Prob. 18RQCh. 26 - An XY individual inherits a mutation that results...Ch. 26 - Prob. 20RQCh. 26 - The following graph shows the results of an...
Knowledge Booster
Learn more about
Need a deep-dive on the concept behind this application? Look no further. Learn more about this topic, biology and related others by exploring similar questions and additional content below.Similar questions
- A farmer has noticed that his soybean plants produce more beans in some years than others. He claims to always apply the same amount of fertilizer to the plants, but he suspects the difference in crop yield may have something to do with the amount of water the crops receive. The farmer has observed that the soybeans on his farm usually receive between 0 to 0.5 inches of water per day, but he is unsure of the optimal average daily amount of water with which to irrigate. 1. State a question that addresses the farmer’s problem 2. Conduct online research on “soybean crop irrigation" and record a brief summary of the findings 3. Construct a testable hypothesis and record i 4. Design an experiment to test the hypothesis and describe the procedures, variables, and data to be collectedarrow_forwardA pharmaceutical company has developed a new weight loss drug for adults. Preliminary tests show that the drug seems to be fairly effective in about 75% of test subjects. The drug company thinks that the drug might be most effective in overweight individuals, but they are unsure to whom they should market the product. Use the scientific method to address the pharmaceutical company’s needs: State a research question that addresses the pharmaceutical company's problem Conduct online research on “Body Mass Index” categories and record a brief summary Construct a testable hypothesis and record in Design an experiment to test the hypothesis and describe the procedures, variables, and data to be collected What is the purpose of a control group in an experiment? What would the control groups be for each of your designed experiments in this exercise? Describe the data that would be recorded in each of the experiments you designed. Would it be classified as quantitative or…arrow_forwardPatients with multiple sclerosis frequently suffer from blurred vision. Drug X was developed to reduce blurred vision in healthy patients, but the effectiveness had not been tested on those suffering from multiple sclerosis. A study was conducted to determine if Drug X is effective at reducing blurry vision in multiple sclerosis patients. To be considered effective, a drug must reduce blurred vision by more than 30% in patients. Researchers predicted that a 20 mg dose of the drug would be effective for treating blurred vision in multiple sclerosis patients by reducing blurred vision by more than 30%. Drug X was administered to groups of multiple sclerosis patients at three doses (10 mg/day, 20 mg/day, 30 mg/day) for three weeks. A fourth group of patients was given a placebo containing no drug X for the same length of time. Vision clarity was measured for each patient before and after the three-week period using a standard vision test. The results were analyzed and graphed (See Figure…arrow_forward
- Svp je voulais demander l aide pour mon exercicearrow_forwardImagine that you are a clinical geneticist. Your colleague is an oncologist who wants your help explaining the basics of genetics to their patient, who will be undergoing genetic testing in the coming weeks for possible acute myeloid leukemia (AML) induced by the radiation she had several years ago for breast cancer. Write a 1,050- to 1,225-word memo to your colleague. Include the following in your memo: An explanation of the molecular structure of DNA and RNA, highlighting both similarities and differences A description of the processes of transcription and translation An explanation of the differences between leading and lagging strands and how the DNA is replicated in each strand Reponses to the following common questions patients might ask about this type of genetic testing and genetic disorder: Does AML run in families? What genes are tested for?arrow_forwardRespond to the following in a minimum of 175 words: What are some potential consequences that could result if the processes of replication, transcription, and translation don’t function correctly? Provide an example of how you might explain these consequences in terms that patients might understand.arrow_forward
- answer questions 1-10arrow_forwardAnswer Question 1-9arrow_forwardEx: Mr. Mandarich wanted to see if the color of light shined on a planthad an effect on the number of leaves it had. He gathered a group ofthe same species of plants, gave them the same amount of water, anddid the test for the same amount of time. Only the color of light waschanged. IV:DV:Constants:Control Gr:arrow_forward
- ethical considerations in medical imagingarrow_forwardPlease correct answer and don't used hand raiting and don't used Ai solutionarrow_forward2. In one of the reactions of the citric acid cycle, malate is oxidized to oxaloacetate. When this reaction is considered in isolation, a small amount of malate remains and is not oxidized. The best term to explain this is a. enthalpy b. entropy c. equilibrium d. free energy e. loss of energyarrow_forward
arrow_back_ios
SEE MORE QUESTIONS
arrow_forward_ios
Recommended textbooks for you
 Biology: The Dynamic Science (MindTap Course List)BiologyISBN:9781305389892Author:Peter J. Russell, Paul E. Hertz, Beverly McMillanPublisher:Cengage LearningEssentials of Pharmacology for Health ProfessionsNursingISBN:9781305441620Author:WOODROWPublisher:Cengage
 Human Physiology: From Cells to Systems (MindTap ...BiologyISBN:9781285866932Author:Lauralee SherwoodPublisher:Cengage Learning
 Human Biology (MindTap Course List)BiologyISBN:9781305112100Author:Cecie Starr, Beverly McMillanPublisher:Cengage Learning
 Nutrition Through The Life CycleHealth & NutritionISBN:9781337919333Author:Brown, Judith E.Publisher:Cengage Learning,

Biology: The Dynamic Science (MindTap Course List)
Biology
ISBN:9781305389892
Author:Peter J. Russell, Paul E. Hertz, Beverly McMillan
Publisher:Cengage Learning

Essentials of Pharmacology for Health Professions
Nursing
ISBN:9781305441620
Author:WOODROW
Publisher:Cengage


Human Physiology: From Cells to Systems (MindTap ...
Biology
ISBN:9781285866932
Author:Lauralee Sherwood
Publisher:Cengage Learning

Human Biology (MindTap Course List)
Biology
ISBN:9781305112100
Author:Cecie Starr, Beverly McMillan
Publisher:Cengage Learning

Nutrition Through The Life Cycle
Health & Nutrition
ISBN:9781337919333
Author:Brown, Judith E.
Publisher:Cengage Learning,
Great Glands - Your Endocrine System: CrashCourse Biology #33; Author: CrashCourse;https://www.youtube.com/watch?v=WVrlHH14q3o;License: Standard Youtube License