Videos
The Grand Canyon Skywalk opened to the public on March 28, 2007. This engineering marvel is a horseshoe-shaped observation platform suspended 4000 ft above the Colorado River on the West Rim of the Grand Canyon. Its crystal-clear glass floor allows stunning views of the canyon below (see the following figure).
The Skywalk is a cantilever design, meaning that the observation platform extends over the rim of the canyon, with no visible means of support below it. Despite the lack of visible support posts or struts, cantilever structures are engineered to be very stable and the Skywalk is no exception. The observation platform is attached firmly to support posts that extend 46 ft down into bedrock. The structure was built to withstand 100-mph winds and an 8.0-magnitude earthquake within 50 mi, and is capable of supporting more than 70,000,000 lb.
One factor affecting the stability of the Skywalk is the center of gravity of the structure. We are going to calculate the center of gravity of the Skywalk, and examine how the center of gravity changes when tourists walk out onto the observation platform.
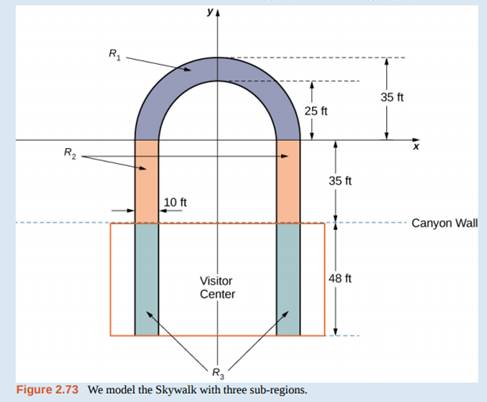
The observation platform is U-shaped. The legs of the U are 10 ft wide and begin on land, under the visitors' center, 48 ft from the edge of the canyon. The platform extends 70 ft over the edge of the canyon.
To calculate the center of mass of the structure, we treat it as a lamina and use a two-dimensional region in the xy-plane to represent the platform. We begin by dividing the region into three subregions so we can consider each subregion separately. The first region, denoted R1, consists of the curved part of the U. We model R1as a semicircular annulus, with inner radius 25 ft and outer radius 35 ft, centered at the origin (see the following figure).
The legs of the platform, extending 35 ft between R1and the canyon wall, comprise the second sub-region, R2, Last, the ends of the legs, which extend 48 ft under the visitor center, comprise the third sub-region, R3. Assume the density of the lamina is constant and assume the total weight of the platform is 1,200,000 lb (not including the weight of the visitor center; we will consider that later). Use g = 32 ft/sec2.
1.Compute the area of each of the three sub-regions. Note that the areas of regions R2and R3should include the areas of the legs only, not the open space between them. Round answers to the nearest square foot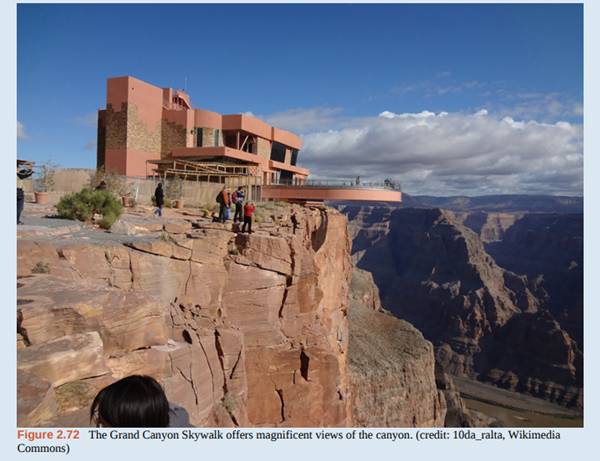
Want to see the full answer?
Check out a sample textbook solution
Chapter 2 Solutions
Calculus Volume 2
Additional Math Textbook Solutions
A Problem Solving Approach To Mathematics For Elementary School Teachers (13th Edition)
A First Course in Probability (10th Edition)
Calculus: Early Transcendentals (2nd Edition)
Elementary Statistics: Picturing the World (7th Edition)
Elementary Statistics (13th Edition)
Precalculus


- 10 15 Answer the following, using the figures and tables from the temperature versus coffee sales data from Questions 1 and 11: a. How many coffees should the manager prepare to make if the temperature is 32°F? b. As the temperature drops, how much more coffee will consumers purchase?ov (Hint: Use the slope.) 21 bru sug c. For what temperature values does the voy marw regression line make the best predictions? al X al 1090391-Yrit,vewolf 30-X Inlog arts bauoxs 268 PART 4 Statistical Studies and the Hunt forarrow_forward18 Using the results from the rainfall versus corn production data in Question 14, answer DOV 15 the following: a. Find and interpret the slope in the con- text of this problem. 79 b. Find the Y-intercept in the context of this problem. alb to sig c. Can the Y-intercept be interpreted here? (.ob or grinisiques xs as 101 gniwollol edt 958 orb sz) asiques sich ed: flow wo PEMAIarrow_forwardLet U = = {0, 1, 2, 3, 4, 5, 6, 7, 8, 9, 10} be the universal set. Use the following subsets of U to determine if each statement is true or false. A = {0, 1, 3, 5} and B = {2, 3, 4, 5,9} • true AUB = {3,5} • true A - B = {0, 1} ⚫ true B = {0, 1, 6, 7, 8, 10} ⚫ true An Bc • true (AUB) = {0,1} = {0, 1, 2, 4, 6, 7, 8, 9, 10} ⚫ true A x B = {(0,2), (1, 3), (3, 4), (5,5)}arrow_forward
- Let A = {x Z | x=0 (mod 6)} and B = {x = Z | x = 0 (mod 9)}. Which of the following sentences describes the set relationship between A and B ? *Keep in mind that Ç means proper subset. AÇ B BÇA A = B AnB = 0 none of thesearrow_forwardLet U = {0, 1, 2, 3, 4, 5, 6, 7, 8, 9, 10} be the universal set. Let A = {0, 1, 2, 3, 9} and B = {2, 3, 4, 5, 6}. Select all elements in An B. 2 3 4 5 18 7 8 9 ☐ 10arrow_forwardLet U = {0, 1, 2, 3, 4, 5, 6, 7, 8, 9, 10} be the universal set. Let A = {0, 1, 2, 3, 9} and B = {2, 3, 4, 5, 6}. Select all elements in An B. 1 2 ✓ 3 + 5 10 7 > 00 ☐ 10arrow_forward
- Variable Total score (Y) Putts hit (X) Mean. 93.900 35.780 Standard Deviation 7.717 4.554 Correlation 0.896arrow_forward17 Referring to the figures and tables from the golf data in Questions 3 and 13, what hap- pens as you keep increasing X? Does Y increase forever? Explain. comis word ே om zol 6 svari woy wol visy alto su and vibed si s'ablow it bas akiog vino b tad) beil Bopara Aon csu How wod griz -do 30 義arrow_forwardVariable Temperature (X) Coffees sold (Y) Mean 35.08 29,913 Standard Deviation 16.29 12,174 Correlation -0.741arrow_forward
- 13 A golf analyst measures the total score and number of putts hit for 100 rounds of golf an amateur plays; you can see the summary of statistics in the following table. (See the figure in Question 3 for a scatterplot of this data.)noitoloqpics bella a. Is it reasonable to use a line to fit this data? Explain. 101 250 b. Find the equation of the best fitting 15er regression line. ad aufstuess som 'moob Y lo esulav in X ni ognado a tad Variable on Mean Standard Correlation 92 Deviation Total score (Y) 93.900 7.717 0.896 Putts hit (X) 35.780 4.554 totenololbenq axlam riso voy X to asulisy datdw gribol anil er 08,080.0 zl noitsism.A How atharrow_forwardVariable Bone loss (Y) Age (X) Mean 35.008. 67.992 Standard Deviation 7.684 10.673 Correlation 0.574arrow_forward50 Bone Loss 30 40 20 Scatterplot of Bone Loss vs. Age . [902) 10 50 60 70 80 90 Age a sub adi u xinq (20) E 4 adw I- nyd med ivia .0 What does a scatterplot that shows no linear relationship between X and Y look like?arrow_forward
 Holt Mcdougal Larson Pre-algebra: Student Edition...AlgebraISBN:9780547587776Author:HOLT MCDOUGALPublisher:HOLT MCDOUGAL
 Algebra and Trigonometry (MindTap Course List)AlgebraISBN:9781305071742Author:James Stewart, Lothar Redlin, Saleem WatsonPublisher:Cengage Learning
 College AlgebraAlgebraISBN:9781305115545Author:James Stewart, Lothar Redlin, Saleem WatsonPublisher:Cengage Learning
 Trigonometry (MindTap Course List)TrigonometryISBN:9781337278461Author:Ron LarsonPublisher:Cengage Learning
 Elementary Geometry For College Students, 7eGeometryISBN:9781337614085Author:Alexander, Daniel C.; Koeberlein, Geralyn M.Publisher:Cengage,