
Concept explainers
Videos
a.
To test and conclude: Whether there is a relationship between the highest degrees obtained and attended religious services.
a.
Answer to Problem 25.44E
There is sufficient evidence to support the claim that there is a relationship between the highest degrees obtained and attended religious services. That is, the attending religious service has effect on getting degrees.
Explanation of Solution
Given info:
The statement “Did any one attended religious services last week” was asked to randomly selected subjects.
Calculation:
The claim is to test whether there is any relationship between the highest degrees obtained and attended religious services.
Cell frequency for using Chi-square test:
When at most 20% of the cell frequencies are less than 5
If all the individual frequencies are 1 or more than 1.
All the expected frequencies must be 5 or greater than 5
The hypotheses used for testing are given below:
Software procedure:
Software procedure for calculating the chi-square test statistic is given below:
Click on Stat, select Tables and then click on Chi-square Test (Two-way table in a worksheet).
Under Columns containing the table: enter the columns of High School, Junior College, Bachelor, and Graduate.
Click ok.
Output obtained from MINITAB is given below:
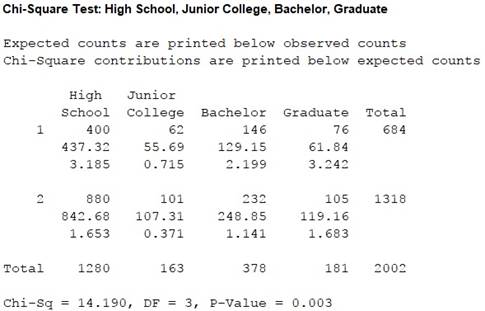
Thus, the test statistic is 14.190, the degree of freedom is 3 and the P-value is 0.003.
Since all the expected frequencies are greater than 5, the usage of chi-square test is appropriate.
Conclusion:
The P-value is 0.003 and level of significance is 0.05.
Thus, the P-value is lesser than the level of significance.
The null hypothesis is rejected.
Thus, there is sufficient evidence to support the claim that there is a relationship between the highest degrees obtained and attended religious services.
b.
To make: A
To test: Whether there is relationship between the types of highest degrees obtained and attended religious services and describes the result.
b.
Answer to Problem 25.44E
The
| Highest degree obtained | |||
| Attended Services | Junior College | Bachelor | Graduate |
| Yes | 62 | 146 | 76 |
| No | 101 | 232 | 105 |
There is no sufficient evidence to support the claim that there is relationship between the types of highest degrees obtained and attended religious services.
The relationship between the types of highest degrees obtained and attended religious services changes.
Explanation of Solution
Calculation:
The claim is to test whether there is any relationship between the types of highest degrees obtained and attended religious services.
The hypotheses used for testing are given below:
Software procedure:
Software procedure for calculating the chi-square test statistic is given below:
- Click on Stat, select Tables and then click on Chi-square Test (Two-way table in a worksheet).
- Under Columns containing the table: enter the columns of Junior College, Bachelor, and Graduate.
- Click ok.
Output obtained from MINITAB is given below:
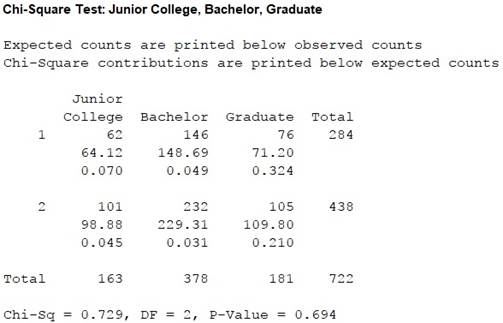
Thus, the test statistic is 0.729, the degree of freedom is 2 and the P-value is 0.694.
Since all the expected frequencies are greater than 5, the usage of chi-square test is appropriate.
Conclusion:
The P-value is 0.694 and level of significance is 0.05
Thus, the P-value is greater than the level of significance.
The null hypothesis is not rejected.
Thus, there is no sufficient evidence to support the claim that there is relationship between the types of highest degrees obtained and attended religious services.
When the High school degree column is omitted, the relationship between the types of highest degrees obtained and attended religious services do not exist.
c.
To make: A
To test: Whether there is relationship between getting a degree beyond high school and attended religious services.
c.
Answer to Problem 25.44E
The
| Highest Degree obtained | ||
| Attended Services | High School | Degrees beyond High School |
| Yes | 62 | 284 |
| No | 101 | 438 |
There is not sufficient evidence to support the claim that there is relationship between getting a degree beyond high school and attended religious services
There is no influence of attending religious services on getting highest degree hold.
Explanation of Solution
Calculation:
A two way table by adding the columns of “Junior School”, “Bachelor” and “Graduate” is given below:
| Highest Degree obtained | ||||
| Attended Services | Junior College | Bachelor | Graduate | Total |
| Yes | 62 | 146 | 76 | 284 |
| No | 101 | 232 | 105 | 438 |
Thus, combining the total obtained from the above table and the column of “High school”. The
| Highest Degree obtained | ||
| Attended Services | High School | Degrees beyond High School |
| Yes | 62 | 284 |
| No | 101 | 438 |
The claim is to test whether there is any relationship between getting a degree beyond high school and attended religious services.
The hypotheses used for testing are given below:
Software procedure:
Step by step procedure for calculating the chi-square test statistic using MINITAB software.
- Click on Stat, select Tables and then click on Chi-square Test (Two-way table in a worksheet).
- Under Columns containing the table: enter the columns of High School and Degree beyond high school.
- Click ok.
Output obtained from MINITAB is given below:
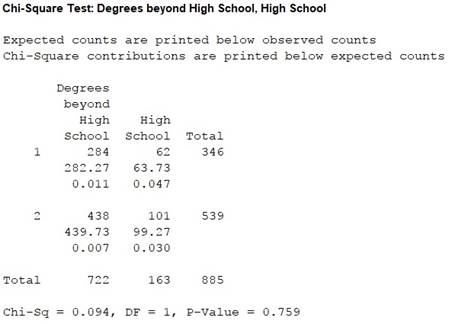
Thus, the test statistic is 0.094, the degree of freedom is 1 and the P-value is 0.759.
Since all the expected frequencies are greater than 5, the usage of chi-square test is appropriate.
Conclusion:
The P-value is 0.759 and level of significance is 0.05
Thus, the P-value is greater than the level of significance.
The null hypothesis is not rejected.
Thus, there is no sufficient evidence to support the claim that there is a relationship between getting a degree beyond high school and attended religious services.
d.
To explain: The relationship between the highest degree obtained and attending religious services in part (a), (b) and (c).
To find: The percentage who attended religious services across each category of highest degree obtained.
d.
Answer to Problem 25.44E
The relationship between the highest degree obtained and attending religious services depends on the individuals or the samples because High school people have higher percentage in attending religious service.
After omitting the “High School” column, the analysis shows no relationship between the highest degree obtained and attending religious services.
The percentage who attended religious services across each category of highest degree is given below:
| Highest Degree Hold | Percentage of Attended services |
| High School | 58.5% |
| Junior College | 9.1% |
| Bachelor | 21.3% |
| Graduate | 11.1% |
Explanation of Solution
From the analysis obtained in part (a), there is a relationship between the attended religious services and highest degree.
From the analysis obtained in part (b), there is no relationship between the attended religious services and highest degree because the column “High school” is left out from the analysis.
From the analysis obtained in part (c), there is no relationship between the attended religious services and highest degree because the columns of “Junior School”, “Bachelor” and “Graduate” and the analysis was carried out.
The above result shows that the highest degree is affected by attending religious services.
Calculation:
The percentage who attended religious services across each category of highest degree is calculated below:
| Highest Degree Hold | Percentage of Attended services |
| High School | |
| Junior College | |
| Bachelor | |
| Graduate |
Want to see more full solutions like this?
Chapter 25 Solutions
BASIC PRAC OF STATISTICS+LAUNCHPAD+REE


- Using the accompanying Accounting Professionals data to answer the following questions. a. Find and interpret a 90% confidence interval for the mean years of service. b. Find and interpret a 90% confidence interval for the proportion of employees who have a graduate degree. view the Accounting Professionals data. Employee Years of Service Graduate Degree?1 26 Y2 8 N3 10 N4 6 N5 23 N6 5 N7 8 Y8 5 N9 26 N10 14 Y11 10 N12 8 Y13 7 Y14 27 N15 16 Y16 17 N17 21 N18 9 Y19 9 N20 9 N Question content area bottom Part 1 a. A 90% confidence interval for the mean years of service is (Use ascending order. Round to two decimal places as needed.)arrow_forwardIf, based on a sample size of 900,a political candidate finds that 509people would vote for him in a two-person race, what is the 95%confidence interval for his expected proportion of the vote? Would he be confident of winning based on this poll? Question content area bottom Part 1 A 9595% confidence interval for his expected proportion of the vote is (Use ascending order. Round to four decimal places as needed.)arrow_forwardQuestions An insurance company's cumulative incurred claims for the last 5 accident years are given in the following table: Development Year Accident Year 0 2018 1 2 3 4 245 267 274 289 292 2019 255 276 288 294 2020 265 283 292 2021 263 278 2022 271 It can be assumed that claims are fully run off after 4 years. The premiums received for each year are: Accident Year Premium 2018 306 2019 312 2020 318 2021 326 2022 330 You do not need to make any allowance for inflation. 1. (a) Calculate the reserve at the end of 2022 using the basic chain ladder method. (b) Calculate the reserve at the end of 2022 using the Bornhuetter-Ferguson method. 2. Comment on the differences in the reserves produced by the methods in Part 1.arrow_forward
- A population that is uniformly distributed between a=0and b=10 is given in sample sizes 50( ), 100( ), 250( ), and 500( ). Find the sample mean and the sample standard deviations for the given data. Compare your results to the average of means for a sample of size 10, and use the empirical rules to analyze the sampling error. For each sample, also find the standard error of the mean using formula given below. Standard Error of the Mean =sigma/Root Complete the following table with the results from the sampling experiment. (Round to four decimal places as needed.) Sample Size Average of 8 Sample Means Standard Deviation of 8 Sample Means Standard Error 50 100 250 500arrow_forwardA survey of 250250 young professionals found that two dash thirdstwo-thirds of them use their cell phones primarily for e-mail. Can you conclude statistically that the population proportion who use cell phones primarily for e-mail is less than 0.720.72? Use a 95% confidence interval. Question content area bottom Part 1 The 95% confidence interval is left bracket nothing comma nothing right bracket0.60820.6082, 0.72510.7251. As 0.720.72 is within the limits of the confidence interval, we cannot conclude that the population proportion is less than 0.720.72. (Use ascending order. Round to four decimal places as needed.)arrow_forwardI need help with this problem and an explanation of the solution for the image described below. (Statistics: Engineering Probabilities)arrow_forward
- A survey of 250 young professionals found that two-thirds of them use their cell phones primarily for e-mail. Can you conclude statistically that the population proportion who use cell phones primarily for e-mail is less than 0.72? Use a 95% confidence interval. Question content area bottom Part 1 The 95% confidence interval is [ ], [ ] As 0.72 is ▼ above the upper limit within the limits below the lower limit of the confidence interval, we ▼ can cannot conclude that the population proportion is less than 0.72. (Use ascending order. Round to four decimal places as needed.)arrow_forwardI need help with this problem and an explanation of the solution for the image described below. (Statistics: Engineering Probabilities)arrow_forwardI need help with this problem and an explanation of the solution for the image described below. (Statistics: Engineering Probabilities)arrow_forward
- I need help with this problem and an explanation of the solution for the image described below. (Statistics: Engineering Probabilities)arrow_forwardQuestions An insurance company's cumulative incurred claims for the last 5 accident years are given in the following table: Development Year Accident Year 0 2018 1 2 3 4 245 267 274 289 292 2019 255 276 288 294 2020 265 283 292 2021 263 278 2022 271 It can be assumed that claims are fully run off after 4 years. The premiums received for each year are: Accident Year Premium 2018 306 2019 312 2020 318 2021 326 2022 330 You do not need to make any allowance for inflation. 1. (a) Calculate the reserve at the end of 2022 using the basic chain ladder method. (b) Calculate the reserve at the end of 2022 using the Bornhuetter-Ferguson method. 2. Comment on the differences in the reserves produced by the methods in Part 1.arrow_forwardQuestions An insurance company's cumulative incurred claims for the last 5 accident years are given in the following table: Development Year Accident Year 0 2018 1 2 3 4 245 267 274 289 292 2019 255 276 288 294 2020 265 283 292 2021 263 278 2022 271 It can be assumed that claims are fully run off after 4 years. The premiums received for each year are: Accident Year Premium 2018 306 2019 312 2020 318 2021 326 2022 330 You do not need to make any allowance for inflation. 1. (a) Calculate the reserve at the end of 2022 using the basic chain ladder method. (b) Calculate the reserve at the end of 2022 using the Bornhuetter-Ferguson method. 2. Comment on the differences in the reserves produced by the methods in Part 1.arrow_forward
 MATLAB: An Introduction with ApplicationsStatisticsISBN:9781119256830Author:Amos GilatPublisher:John Wiley & Sons Inc
 Probability and Statistics for Engineering and th...StatisticsISBN:9781305251809Author:Jay L. DevorePublisher:Cengage Learning
 Statistics for The Behavioral Sciences (MindTap C...StatisticsISBN:9781305504912Author:Frederick J Gravetter, Larry B. WallnauPublisher:Cengage Learning
 Elementary Statistics: Picturing the World (7th E...StatisticsISBN:9780134683416Author:Ron Larson, Betsy FarberPublisher:PEARSON
 The Basic Practice of StatisticsStatisticsISBN:9781319042578Author:David S. Moore, William I. Notz, Michael A. FlignerPublisher:W. H. Freeman
 Introduction to the Practice of StatisticsStatisticsISBN:9781319013387Author:David S. Moore, George P. McCabe, Bruce A. CraigPublisher:W. H. Freeman