Concept explainers
Videos
a.
To test and conclude: Whether there is a relationship between the highest degrees obtained and attended religious services.
a.
Answer to Problem 25.44E
There is sufficient evidence to support the claim that there is a relationship between the highest degrees obtained and attended religious services. That is, the attending religious service has effect on getting degrees.
Explanation of Solution
Given info:
The statement “Did any one attended religious services last week” was asked to randomly selected subjects.
Calculation:
The claim is to test whether there is any relationship between the highest degrees obtained and attended religious services.
Cell frequency for using Chi-square test:
When at most 20% of the cell frequencies are less than 5
If all the individual frequencies are 1 or more than 1.
All the expected frequencies must be 5 or greater than 5
The hypotheses used for testing are given below:
Software procedure:
Software procedure for calculating the chi-square test statistic is given below:
Click on Stat, select Tables and then click on Chi-square Test (Two-way table in a worksheet).
Under Columns containing the table: enter the columns of High School, Junior College, Bachelor, and Graduate.
Click ok.
Output obtained from MINITAB is given below:
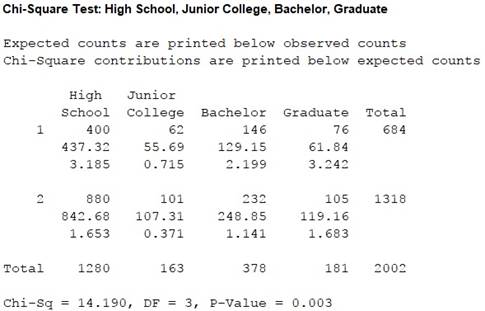
Thus, the test statistic is 14.190, the degree of freedom is 3 and the P-value is 0.003.
Since all the expected frequencies are greater than 5, the usage of chi-square test is appropriate.
Conclusion:
The P-value is 0.003 and level of significance is 0.05.
Thus, the P-value is lesser than the level of significance.
The null hypothesis is rejected.
Thus, there is sufficient evidence to support the claim that there is a relationship between the highest degrees obtained and attended religious services.
b.
To make: A
To test: Whether there is relationship between the types of highest degrees obtained and attended religious services and describes the result.
b.
Answer to Problem 25.44E
The
| Highest degree obtained | |||
| Attended Services | Junior College | Bachelor | Graduate |
| Yes | 62 | 146 | 76 |
| No | 101 | 232 | 105 |
There is no sufficient evidence to support the claim that there is relationship between the types of highest degrees obtained and attended religious services.
The relationship between the types of highest degrees obtained and attended religious services changes.
Explanation of Solution
Calculation:
The claim is to test whether there is any relationship between the types of highest degrees obtained and attended religious services.
The hypotheses used for testing are given below:
Software procedure:
Software procedure for calculating the chi-square test statistic is given below:
- Click on Stat, select Tables and then click on Chi-square Test (Two-way table in a worksheet).
- Under Columns containing the table: enter the columns of Junior College, Bachelor, and Graduate.
- Click ok.
Output obtained from MINITAB is given below:
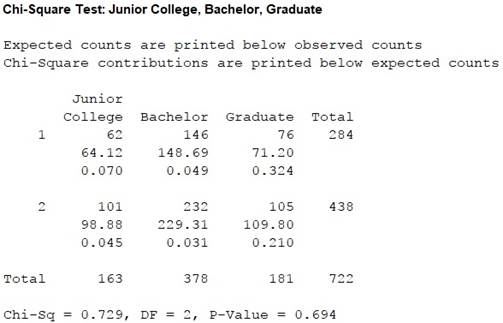
Thus, the test statistic is 0.729, the degree of freedom is 2 and the P-value is 0.694.
Since all the expected frequencies are greater than 5, the usage of chi-square test is appropriate.
Conclusion:
The P-value is 0.694 and level of significance is 0.05
Thus, the P-value is greater than the level of significance.
The null hypothesis is not rejected.
Thus, there is no sufficient evidence to support the claim that there is relationship between the types of highest degrees obtained and attended religious services.
When the High school degree column is omitted, the relationship between the types of highest degrees obtained and attended religious services do not exist.
c.
To make: A
To test: Whether there is relationship between getting a degree beyond high school and attended religious services.
c.
Answer to Problem 25.44E
The
| Highest Degree obtained | ||
| Attended Services | High School | Degrees beyond High School |
| Yes | 62 | 284 |
| No | 101 | 438 |
There is not sufficient evidence to support the claim that there is relationship between getting a degree beyond high school and attended religious services
There is no influence of attending religious services on getting highest degree hold.
Explanation of Solution
Calculation:
A two way table by adding the columns of “Junior School”, “Bachelor” and “Graduate” is given below:
| Highest Degree obtained | ||||
| Attended Services | Junior College | Bachelor | Graduate | Total |
| Yes | 62 | 146 | 76 | 284 |
| No | 101 | 232 | 105 | 438 |
Thus, combining the total obtained from the above table and the column of “High school”. The
| Highest Degree obtained | ||
| Attended Services | High School | Degrees beyond High School |
| Yes | 62 | 284 |
| No | 101 | 438 |
The claim is to test whether there is any relationship between getting a degree beyond high school and attended religious services.
The hypotheses used for testing are given below:
Software procedure:
Step by step procedure for calculating the chi-square test statistic using MINITAB software.
- Click on Stat, select Tables and then click on Chi-square Test (Two-way table in a worksheet).
- Under Columns containing the table: enter the columns of High School and Degree beyond high school.
- Click ok.
Output obtained from MINITAB is given below:
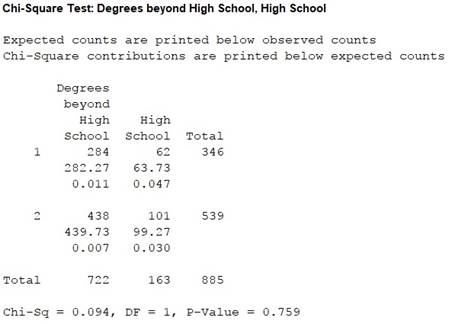
Thus, the test statistic is 0.094, the degree of freedom is 1 and the P-value is 0.759.
Since all the expected frequencies are greater than 5, the usage of chi-square test is appropriate.
Conclusion:
The P-value is 0.759 and level of significance is 0.05
Thus, the P-value is greater than the level of significance.
The null hypothesis is not rejected.
Thus, there is no sufficient evidence to support the claim that there is a relationship between getting a degree beyond high school and attended religious services.
d.
To explain: The relationship between the highest degree obtained and attending religious services in part (a), (b) and (c).
To find: The percentage who attended religious services across each category of highest degree obtained.
d.
Answer to Problem 25.44E
The relationship between the highest degree obtained and attending religious services depends on the individuals or the samples because High school people have higher percentage in attending religious service.
After omitting the “High School” column, the analysis shows no relationship between the highest degree obtained and attending religious services.
The percentage who attended religious services across each category of highest degree is given below:
| Highest Degree Hold | Percentage of Attended services |
| High School | 58.5% |
| Junior College | 9.1% |
| Bachelor | 21.3% |
| Graduate | 11.1% |
Explanation of Solution
From the analysis obtained in part (a), there is a relationship between the attended religious services and highest degree.
From the analysis obtained in part (b), there is no relationship between the attended religious services and highest degree because the column “High school” is left out from the analysis.
From the analysis obtained in part (c), there is no relationship between the attended religious services and highest degree because the columns of “Junior School”, “Bachelor” and “Graduate” and the analysis was carried out.
The above result shows that the highest degree is affected by attending religious services.
Calculation:
The percentage who attended religious services across each category of highest degree is calculated below:
| Highest Degree Hold | Percentage of Attended services |
| High School | |
| Junior College | |
| Bachelor | |
| Graduate |
Want to see more full solutions like this?
Chapter 25 Solutions
EBK THE BASIC PRACTICE OF STATISTICS


- A normal distribution has a mean of 50 and a standard deviation of 4. Solve the following three parts? 1. Compute the probability of a value between 44.0 and 55.0. (The question requires finding probability value between 44 and 55. Solve it in 3 steps. In the first step, use the above formula and x = 44, calculate probability value. In the second step repeat the first step with the only difference that x=55. In the third step, subtract the answer of the first part from the answer of the second part.) 2. Compute the probability of a value greater than 55.0. Use the same formula, x=55 and subtract the answer from 1. 3. Compute the probability of a value between 52.0 and 55.0. (The question requires finding probability value between 52 and 55. Solve it in 3 steps. In the first step, use the above formula and x = 52, calculate probability value. In the second step repeat the first step with the only difference that x=55. In the third step, subtract the answer of the first part from the…arrow_forwardIf a uniform distribution is defined over the interval from 6 to 10, then answer the followings: What is the mean of this uniform distribution? Show that the probability of any value between 6 and 10 is equal to 1.0 Find the probability of a value more than 7. Find the probability of a value between 7 and 9. The closing price of Schnur Sporting Goods Inc. common stock is uniformly distributed between $20 and $30 per share. What is the probability that the stock price will be: More than $27? Less than or equal to $24? The April rainfall in Flagstaff, Arizona, follows a uniform distribution between 0.5 and 3.00 inches. What is the mean amount of rainfall for the month? What is the probability of less than an inch of rain for the month? What is the probability of exactly 1.00 inch of rain? What is the probability of more than 1.50 inches of rain for the month? The best way to solve this problem is begin by a step by step creating a chart. Clearly mark the range, identifying the…arrow_forwardClient 1 Weight before diet (pounds) Weight after diet (pounds) 128 120 2 131 123 3 140 141 4 178 170 5 121 118 6 136 136 7 118 121 8 136 127arrow_forward
- Client 1 Weight before diet (pounds) Weight after diet (pounds) 128 120 2 131 123 3 140 141 4 178 170 5 121 118 6 136 136 7 118 121 8 136 127 a) Determine the mean change in patient weight from before to after the diet (after – before). What is the 95% confidence interval of this mean difference?arrow_forwardIn order to find probability, you can use this formula in Microsoft Excel: The best way to understand and solve these problems is by first drawing a bell curve and marking key points such as x, the mean, and the areas of interest. Once marked on the bell curve, figure out what calculations are needed to find the area of interest. =NORM.DIST(x, Mean, Standard Dev., TRUE). When the question mentions “greater than” you may have to subtract your answer from 1. When the question mentions “between (two values)”, you need to do separate calculation for both values and then subtract their results to get the answer. 1. Compute the probability of a value between 44.0 and 55.0. (The question requires finding probability value between 44 and 55. Solve it in 3 steps. In the first step, use the above formula and x = 44, calculate probability value. In the second step repeat the first step with the only difference that x=55. In the third step, subtract the answer of the first part from the…arrow_forwardIf a uniform distribution is defined over the interval from 6 to 10, then answer the followings: What is the mean of this uniform distribution? Show that the probability of any value between 6 and 10 is equal to 1.0 Find the probability of a value more than 7. Find the probability of a value between 7 and 9. The closing price of Schnur Sporting Goods Inc. common stock is uniformly distributed between $20 and $30 per share. What is the probability that the stock price will be: More than $27? Less than or equal to $24? The April rainfall in Flagstaff, Arizona, follows a uniform distribution between 0.5 and 3.00 inches. What is the mean amount of rainfall for the month? What is the probability of less than an inch of rain for the month? What is the probability of exactly 1.00 inch of rain? What is the probability of more than 1.50 inches of rain for the month? The best way to solve this problem is begin by creating a chart. Clearly mark the range, identifying the lower and upper…arrow_forward
- Problem 1: The mean hourly pay of an American Airlines flight attendant is normally distributed with a mean of 40 per hour and a standard deviation of 3.00 per hour. What is the probability that the hourly pay of a randomly selected flight attendant is: Between the mean and $45 per hour? More than $45 per hour? Less than $32 per hour? Problem 2: The mean of a normal probability distribution is 400 pounds. The standard deviation is 10 pounds. What is the area between 415 pounds and the mean of 400 pounds? What is the area between the mean and 395 pounds? What is the probability of randomly selecting a value less than 395 pounds? Problem 3: In New York State, the mean salary for high school teachers in 2022 was 81,410 with a standard deviation of 9,500. Only Alaska’s mean salary was higher. Assume New York’s state salaries follow a normal distribution. What percent of New York State high school teachers earn between 70,000 and 75,000? What percent of New York State high school…arrow_forwardPls help asaparrow_forwardSolve the following LP problem using the Extreme Point Theorem: Subject to: Maximize Z-6+4y 2+y≤8 2x + y ≤10 2,y20 Solve it using the graphical method. Guidelines for preparation for the teacher's questions: Understand the basics of Linear Programming (LP) 1. Know how to formulate an LP model. 2. Be able to identify decision variables, objective functions, and constraints. Be comfortable with graphical solutions 3. Know how to plot feasible regions and find extreme points. 4. Understand how constraints affect the solution space. Understand the Extreme Point Theorem 5. Know why solutions always occur at extreme points. 6. Be able to explain how optimization changes with different constraints. Think about real-world implications 7. Consider how removing or modifying constraints affects the solution. 8. Be prepared to explain why LP problems are used in business, economics, and operations research.arrow_forward
- ged the variance for group 1) Different groups of male stalk-eyed flies were raised on different diets: a high nutrient corn diet vs. a low nutrient cotton wool diet. Investigators wanted to see if diet quality influenced eye-stalk length. They obtained the following data: d Diet Sample Mean Eye-stalk Length Variance in Eye-stalk d size, n (mm) Length (mm²) Corn (group 1) 21 2.05 0.0558 Cotton (group 2) 24 1.54 0.0812 =205-1.54-05T a) Construct a 95% confidence interval for the difference in mean eye-stalk length between the two diets (e.g., use group 1 - group 2).arrow_forwardAn article in Business Week discussed the large spread between the federal funds rate and the average credit card rate. The table below is a frequency distribution of the credit card rate charged by the top 100 issuers. Credit Card Rates Credit Card Rate Frequency 18% -23% 19 17% -17.9% 16 16% -16.9% 31 15% -15.9% 26 14% -14.9% Copy Data 8 Step 1 of 2: Calculate the average credit card rate charged by the top 100 issuers based on the frequency distribution. Round your answer to two decimal places.arrow_forwardPlease could you check my answersarrow_forward
 MATLAB: An Introduction with ApplicationsStatisticsISBN:9781119256830Author:Amos GilatPublisher:John Wiley & Sons Inc
 Probability and Statistics for Engineering and th...StatisticsISBN:9781305251809Author:Jay L. DevorePublisher:Cengage Learning
 Statistics for The Behavioral Sciences (MindTap C...StatisticsISBN:9781305504912Author:Frederick J Gravetter, Larry B. WallnauPublisher:Cengage Learning
 Elementary Statistics: Picturing the World (7th E...StatisticsISBN:9780134683416Author:Ron Larson, Betsy FarberPublisher:PEARSON
 The Basic Practice of StatisticsStatisticsISBN:9781319042578Author:David S. Moore, William I. Notz, Michael A. FlignerPublisher:W. H. Freeman
 Introduction to the Practice of StatisticsStatisticsISBN:9781319013387Author:David S. Moore, George P. McCabe, Bruce A. CraigPublisher:W. H. Freeman