
a.
To construct: The 99% confidence interval for the proportion of Americans who are more than 50 years of age and also current smokers.
a.
Answer to Problem 25.42E
The 99% confidence interval for the proportion of Americans who are more than 50 years of age and also current smokers is 0.0826 to 0.1057or 8.26% to 10.57%.
Explanation of Solution
Given info:
The data shows the results obtained by asking two questions to a random sample of 50 year old adults “How do your overall health, excellent, very good, good, fair and poor?” and the second question is “Do you smoke currently, yes or no?”
Calculation:
Let
Thus, the proportion of Americans who are more than 50 years of age and currently smoking is 0.094.
Software procedure:
Step-by-step procedure for constructing 99% confidence interval for the given proportion is shown below:
- Click on Stat, Basic statistics and 1-proportion.
- Choose Summarized data, under Number of
events enter 404, under Number of trials enter 4,310. - Click on options, choose 99% confidence interval.
- Click ok.
Output using MINITAB is given below:
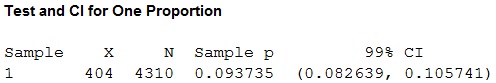
Thus, the 99% confidence interval for the proportion of Americans who are more than who are more than 50 years of age and also current smokers is 0.0826 to 0.1057.
b.
To compare: The two conditional distributions and also the graph of conditional distributions.
To find: The conditional distribution of age for the Americans who use social networking sitesand who don’t use social networking siteson their phones.
To construct: A suitable graph for the conditional distribution of age for the Americans who use social networking sitesand who don’t use social networking siteson their phones.
b.
Answer to Problem 25.42E
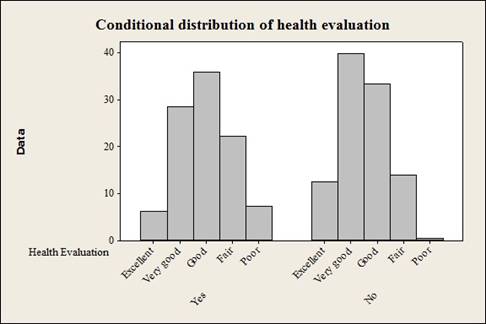
- The bar graph and the conditional distributions show that Americans are currently smoking have lowest percentages in “excellent” and “very good” health evaluation whereas Americans who are not currently smoking have highest percentages in “excellent” and “very good” health evaluation.
- The percentages in “fair and poor” health evaluation is more in currently smoking group when compared to the percentages for the same categories under not currently smoking group.
The conditional distribution of health evaluation for the Americans who are currently smoking and not currently smoking is given below:
|
Conditional distribution of health evaluation for the Americans who are currently smoking and not currently smoking | ||
| Health Evaluation | Yes | No |
| Excellent | 6.20 | 12.4 |
| Very good | 28.50 | 39.9 |
| Good | 35.90 | 33.5 |
| Fair | 22.30 | 14.0 |
| Poor | 7.18 | 0.3 |
The bar graph showing the conditional distribution of health evaluation for the Americans who are currently smoking and not currently smoking is given below:
- Output obtained from MINITAB is given below:
Explanation of Solution
Calculation:
The conditional distribution of health evaluation for the Americans who are current smokers is calculated as follows:
The conditional distribution of health evaluation for the Americans who are not current smokers is calculated as follows:
The conditional distribution of health evaluation for the Americans who are currently smoking and not currently smoking is given below:
| Conditional distribution of health evaluation for the Americans who are currently smoking and not currently smoking | ||
| Health Evaluation | Yes | No |
| Excellent |
|
|
| Very good |
|
|
| Good |
|
|
| Fair |
|
|
| Poor |
|
|
Software Procedure:
Step-by-step procedure to construct the Bar Chart using the MINITAB software:
- Choose Graph > Bar Chart.
- From Bars represent, choose Values from a table.
- Under Two Columns of values, choose Cluster. Click OK.
- In Graph variables, enter the columns of Yes and No.
- In Row labels, enter “Health Evaluation”.
- In Table arrangement, click “columns are outermost categories and columns are innermost”.
- Click OK.
- Interpretation:
- The bar chart for comparing two conditional distributions is constructed with bars to the extreme left side of the graph, which represents the currently smoking group.
- c.
- To test: Whether there is a significant difference between health evaluation and currently smoking and not currently smoking group.
- To find: The mean value of the test statistic given that the null hypothesis is true.
- To give: The P-value.
- c.
Answer to Problem 25.42E
- There is a significant difference between health evaluation and currently smoking and not currently smoking group.
- The mean value of the chi-square test statistic given that the null hypothesis is true is given is to be 4.
- The P-value is 0.000.
Explanation of Solution
- Calculation:
- The claim is to test whether there is any significant difference between health evaluation and currently smoking and not currently smoking group.
Cell frequency for using Chi-square test:
- When at most 20% of the cell frequencies are less than 5
- If all the individual frequencies are 1 or more than 1.
- All the expected frequencies must be 5 or greater than 5
The hypotheses used for testing are given below:
Software procedure:
Step-by-stepprocedure for calculating the chi-square test statistic is given below:
- Click on Stat, select Tables and then click on Chi-square Test (Two-way table in a worksheet).
- Under Columns containing the table: enter the columns of Yes and No.
- Click ok.
Output obtained from MINITAB is given below:
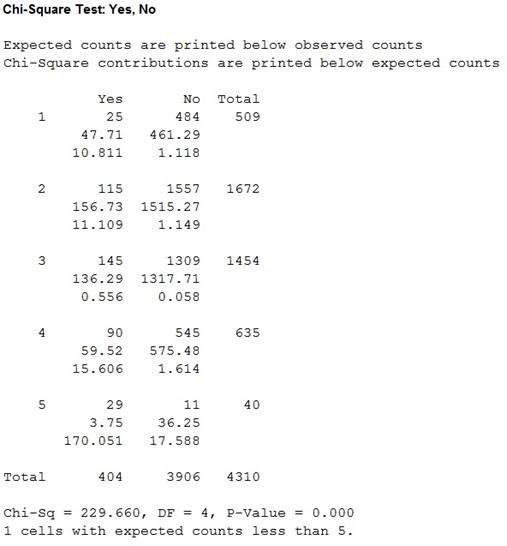
Thus, the test statistic is 229.660, the degree of freedom is 4, and the P-value is 0.000.
Only one cell is having an expected frequency less than 5. The usage of chi-square test is appropriate.
Conclusion:
The P-value is 0.000 and the level of significance is 0.05.
Here, the P-value is less than the level of significance.
Therefore, the null hypothesis is rejected.
Thus, there is sufficient evidence to support the claim that there is a significant difference between health evaluation and currently smoking and not currently smoking group.
Justification:
Fact:
If the null hypothesis is true, then the mean of any chi-square distribution is equal to its degrees of freedom.
From the MINITAB output, it can be observed that the degree of freedom is calculated as 3. So, the mean value of the chi-square statistic is 3.
Thus, the mean value of the chi-square statistic is 3.
Also, the observed chi-square value is
d.
To give: A comparison for the difference in the distribution of age across social media network usage.
d.
Explanation of Solution
Comparison:
From the MINITAB output, it can be seen that the observed frequencies for good, fair and poor health evaluation for currently smoking group is higher than the expected frequency, given that the null hypothesis is true.
In non-smoking group the observed frequencies for good, fair and poor health evaluation is lesser than the expected frequency.
The people who are currently smoking have a poor health condition when compared to the non smoking group.
Hence, there is a significant difference in the health evaluation for currently smoking and not currently smoking group.
Want to see more full solutions like this?
Chapter 25 Solutions
Loose-leaf Version for The Basic Practice of Statistics 7e & LaunchPad (Twelve Month Access)

- This problem is based on the fundamental option pricing formula for the continuous-time model developed in class, namely the value at time 0 of an option with maturity T and payoff F is given by: We consider the two options below: Fo= -rT = e Eq[F]. 1 A. An option with which you must buy a share of stock at expiration T = 1 for strike price K = So. B. An option with which you must buy a share of stock at expiration T = 1 for strike price K given by T K = T St dt. (Note that both options can have negative payoffs.) We use the continuous-time Black- Scholes model to price these options. Assume that the interest rate on the money market is r. (a) Using the fundamental option pricing formula, find the price of option A. (Hint: use the martingale properties developed in the lectures for the stock price process in order to calculate the expectations.) (b) Using the fundamental option pricing formula, find the price of option B. (c) Assuming the interest rate is very small (r ~0), use Taylor…arrow_forwardDiscuss and explain in the picturearrow_forwardBob and Teresa each collect their own samples to test the same hypothesis. Bob’s p-value turns out to be 0.05, and Teresa’s turns out to be 0.01. Why don’t Bob and Teresa get the same p-values? Who has stronger evidence against the null hypothesis: Bob or Teresa?arrow_forward
- Review a classmate's Main Post. 1. State if you agree or disagree with the choices made for additional analysis that can be done beyond the frequency table. 2. Choose a measure of central tendency (mean, median, mode) that you would like to compute with the data beyond the frequency table. Complete either a or b below. a. Explain how that analysis can help you understand the data better. b. If you are currently unable to do that analysis, what do you think you could do to make it possible? If you do not think you can do anything, explain why it is not possible.arrow_forward0|0|0|0 - Consider the time series X₁ and Y₁ = (I – B)² (I – B³)Xt. What transformations were performed on Xt to obtain Yt? seasonal difference of order 2 simple difference of order 5 seasonal difference of order 1 seasonal difference of order 5 simple difference of order 2arrow_forwardCalculate the 90% confidence interval for the population mean difference using the data in the attached image. I need to see where I went wrong.arrow_forward
- Microsoft Excel snapshot for random sampling: Also note the formula used for the last column 02 x✓ fx =INDEX(5852:58551, RANK(C2, $C$2:$C$51)) A B 1 No. States 2 1 ALABAMA Rand No. 0.925957526 3 2 ALASKA 0.372999976 4 3 ARIZONA 0.941323044 5 4 ARKANSAS 0.071266381 Random Sample CALIFORNIA NORTH CAROLINA ARKANSAS WASHINGTON G7 Microsoft Excel snapshot for systematic sampling: xfx INDEX(SD52:50551, F7) A B E F G 1 No. States Rand No. Random Sample population 50 2 1 ALABAMA 0.5296685 NEW HAMPSHIRE sample 10 3 2 ALASKA 0.4493186 OKLAHOMA k 5 4 3 ARIZONA 0.707914 KANSAS 5 4 ARKANSAS 0.4831379 NORTH DAKOTA 6 5 CALIFORNIA 0.7277162 INDIANA Random Sample Sample Name 7 6 COLORADO 0.5865002 MISSISSIPPI 8 7:ONNECTICU 0.7640596 ILLINOIS 9 8 DELAWARE 0.5783029 MISSOURI 525 10 15 INDIANA MARYLAND COLORADOarrow_forwardSuppose the Internal Revenue Service reported that the mean tax refund for the year 2022 was $3401. Assume the standard deviation is $82.5 and that the amounts refunded follow a normal probability distribution. Solve the following three parts? (For the answer to question 14, 15, and 16, start with making a bell curve. Identify on the bell curve where is mean, X, and area(s) to be determined. 1.What percent of the refunds are more than $3,500? 2. What percent of the refunds are more than $3500 but less than $3579? 3. What percent of the refunds are more than $3325 but less than $3579?arrow_forwardA normal distribution has a mean of 50 and a standard deviation of 4. Solve the following three parts? 1. Compute the probability of a value between 44.0 and 55.0. (The question requires finding probability value between 44 and 55. Solve it in 3 steps. In the first step, use the above formula and x = 44, calculate probability value. In the second step repeat the first step with the only difference that x=55. In the third step, subtract the answer of the first part from the answer of the second part.) 2. Compute the probability of a value greater than 55.0. Use the same formula, x=55 and subtract the answer from 1. 3. Compute the probability of a value between 52.0 and 55.0. (The question requires finding probability value between 52 and 55. Solve it in 3 steps. In the first step, use the above formula and x = 52, calculate probability value. In the second step repeat the first step with the only difference that x=55. In the third step, subtract the answer of the first part from the…arrow_forward
- If a uniform distribution is defined over the interval from 6 to 10, then answer the followings: What is the mean of this uniform distribution? Show that the probability of any value between 6 and 10 is equal to 1.0 Find the probability of a value more than 7. Find the probability of a value between 7 and 9. The closing price of Schnur Sporting Goods Inc. common stock is uniformly distributed between $20 and $30 per share. What is the probability that the stock price will be: More than $27? Less than or equal to $24? The April rainfall in Flagstaff, Arizona, follows a uniform distribution between 0.5 and 3.00 inches. What is the mean amount of rainfall for the month? What is the probability of less than an inch of rain for the month? What is the probability of exactly 1.00 inch of rain? What is the probability of more than 1.50 inches of rain for the month? The best way to solve this problem is begin by a step by step creating a chart. Clearly mark the range, identifying the…arrow_forwardClient 1 Weight before diet (pounds) Weight after diet (pounds) 128 120 2 131 123 3 140 141 4 178 170 5 121 118 6 136 136 7 118 121 8 136 127arrow_forwardClient 1 Weight before diet (pounds) Weight after diet (pounds) 128 120 2 131 123 3 140 141 4 178 170 5 121 118 6 136 136 7 118 121 8 136 127 a) Determine the mean change in patient weight from before to after the diet (after – before). What is the 95% confidence interval of this mean difference?arrow_forward
 MATLAB: An Introduction with ApplicationsStatisticsISBN:9781119256830Author:Amos GilatPublisher:John Wiley & Sons Inc
 Probability and Statistics for Engineering and th...StatisticsISBN:9781305251809Author:Jay L. DevorePublisher:Cengage Learning
 Statistics for The Behavioral Sciences (MindTap C...StatisticsISBN:9781305504912Author:Frederick J Gravetter, Larry B. WallnauPublisher:Cengage Learning
 Elementary Statistics: Picturing the World (7th E...StatisticsISBN:9780134683416Author:Ron Larson, Betsy FarberPublisher:PEARSON
 The Basic Practice of StatisticsStatisticsISBN:9781319042578Author:David S. Moore, William I. Notz, Michael A. FlignerPublisher:W. H. Freeman
 Introduction to the Practice of StatisticsStatisticsISBN:9781319013387Author:David S. Moore, George P. McCabe, Bruce A. CraigPublisher:W. H. Freeman