Human Physiology: An Integrated Approach (8th Edition)
8th Edition
ISBN: 9780134605197
Author: Dee Unglaub Silverthorn
Publisher: PEARSON
expand_more
expand_more
format_list_bulleted
Textbook Question
Chapter 25, Problem 21RQ
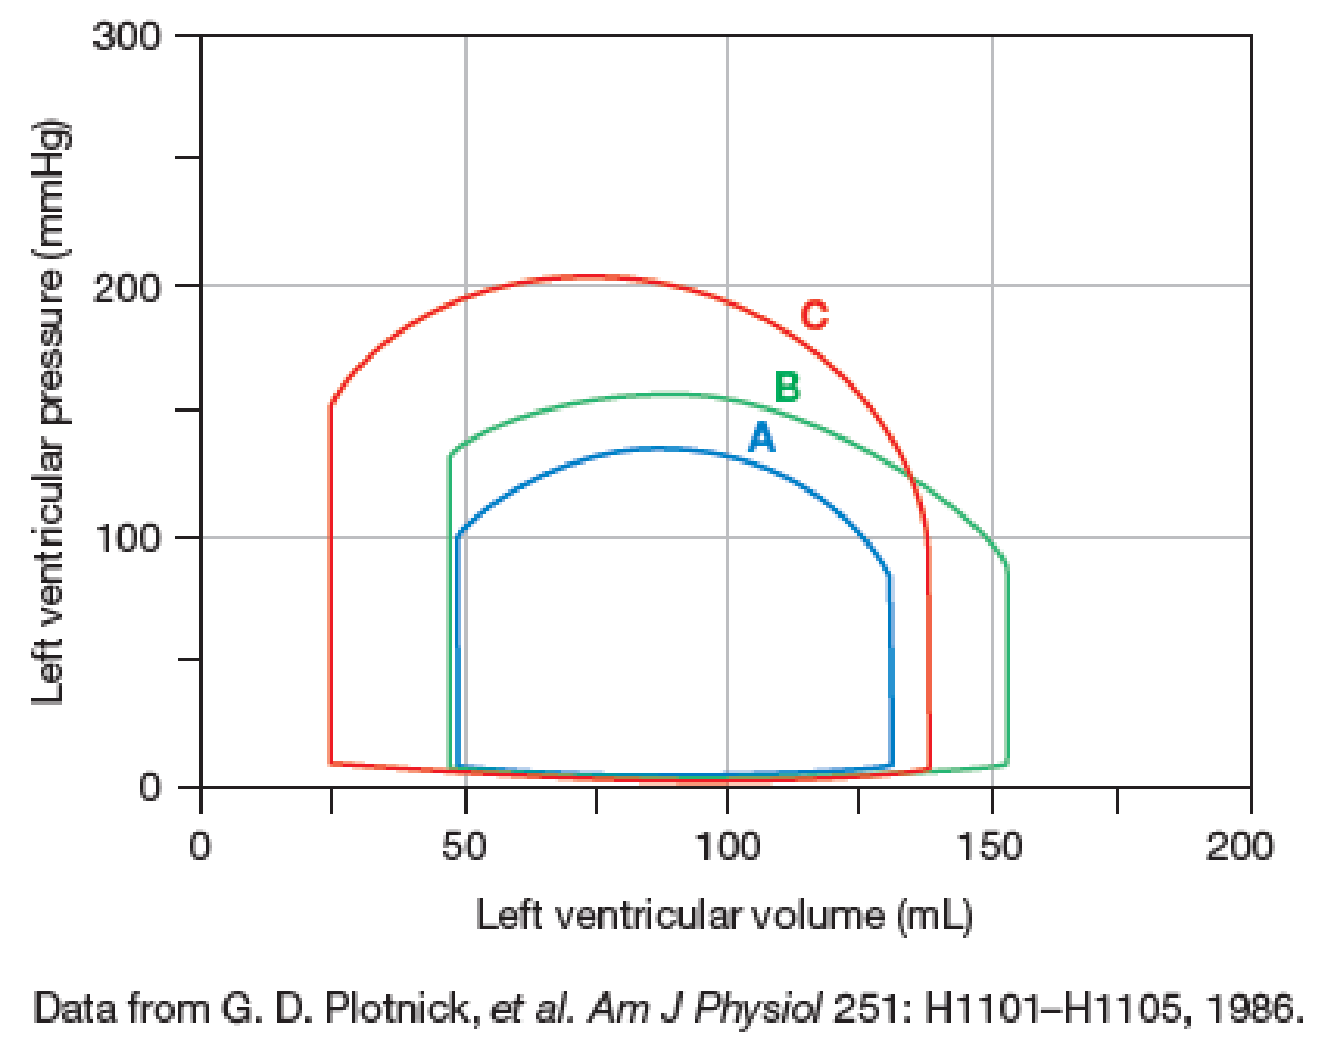
The following graph shows left ventricular pressure-volume curves in one individual. Curve A is the person sitting at rest. Curve B shows the person’s cardiac response to mild exercise on a stationary bicycle. Curve C shows the cardiac response during maximum intensity cycling.
- a. Calculate the stroke volume for each of the curves.
- b. Given the following cardiac outputs (CO), calculate the heart rates for each condition.
COA = 6 L/min, COB = 10.5 L/min, COC = 19 L/min

- c. Which exercise curve shows an increase in stroke volume due primarily to increased contractility? Which exercise curve shows an increase in stroke volume due primarily to increased venous return?
- d. Mechanistically, why did the end-diastolic volume in curve C fall back toward the resting value?
Expert Solution & Answer
Want to see the full answer?
Check out a sample textbook solution
Students have asked these similar questions
State the five functions of Globular Proteins, and give an example of a protein for each function.
Diagram of check cell under low power and high power
a couple in which the father has the a blood type and the mother has the o blood type produce an offspring with the o blood type, how does this happen? how could two functionally O parents produce an offspring that has the a blood type?
Chapter 25 Solutions
Human Physiology: An Integrated Approach (8th Edition)
Ch. 25.2 - If venous PO2 decreases as exercise intensity...Ch. 25.3 - In Figure 25.8b, why does the line for mean blood...Ch. 25.5 - The active vasodilator nerves to the skin secrete...Ch. 25 - Name the two muscle compounds that store energy in...Ch. 25 - Prob. 2RQCh. 25 - Prob. 3RQCh. 25 - Prob. 4RQCh. 25 - Prob. 5RQCh. 25 - What is meant by the term oxygen deficit, and how...Ch. 25 - Prob. 7RQ
Ch. 25 - In endurance events, body temperature can reach...Ch. 25 - Prob. 9RQCh. 25 - Prob. 10RQCh. 25 - Prob. 11RQCh. 25 - Prob. 12RQCh. 25 - Match the following brain areas with the...Ch. 25 - Specify whether each of the following parameters...Ch. 25 - Why doesnt increased venous return during exercise...Ch. 25 - Diagram the three theories that explain why the...Ch. 25 - Prob. 17RQCh. 25 - Explain how exercise decreases blood glucose in...Ch. 25 - Prob. 19RQCh. 25 - Prob. 20RQCh. 25 - The following graph shows left ventricular...
Knowledge Booster
Learn more about
Need a deep-dive on the concept behind this application? Look no further. Learn more about this topic, biology and related others by exploring similar questions and additional content below.Similar questions
- What is the opening indicated by the pointer? (leaf x.s.) stomate guard cell lenticel intercellular space none of thesearrow_forwardIdentify the indicated tissue? (stem x.s.) parenchyma collenchyma sclerenchyma ○ xylem ○ phloem none of thesearrow_forwardWhere did this structure originate from? (Salix branch root) epidermis cortex endodermis pericycle vascular cylinderarrow_forward
- Identify the indicated tissue. (Tilia stem x.s.) parenchyma collenchyma sclerenchyma xylem phloem none of thesearrow_forwardIdentify the indicated structure. (Cucurbita stem l.s.) pit lenticel stomate tendril none of thesearrow_forwardIdentify the specific cell? (Zebrina leaf peel) vessel element sieve element companion cell tracheid guard cell subsidiary cell none of thesearrow_forward
- What type of cells flank the opening on either side? (leaf x.s.) vessel elements sieve elements companion cells tracheids guard cells none of thesearrow_forwardWhat specific cell is indicated. (Cucurbita stem I.s.) vessel element sieve element O companion cell tracheid guard cell none of thesearrow_forwardWhat specific cell is indicated? (Aristolochia stem x.s.) vessel element sieve element ○ companion cell O O O O O tracheid O guard cell none of thesearrow_forward
- Identify the tissue. parenchyma collenchyma sclerenchyma ○ xylem O phloem O none of thesearrow_forwardPlease answer q3arrow_forwardRespond to the following in a minimum of 175 words: How might CRISPR-Cas 9 be used in research or, eventually, therapeutically in patients? What are some potential ethical issues associated with using this technology? Do the advantages of using this technology outweigh the disadvantages (or vice versa)? Explain your position.arrow_forward
arrow_back_ios
SEE MORE QUESTIONS
arrow_forward_ios
Recommended textbooks for you
 Human Physiology: From Cells to Systems (MindTap ...BiologyISBN:9781285866932Author:Lauralee SherwoodPublisher:Cengage LearningBasic Clinical Lab Competencies for Respiratory C...NursingISBN:9781285244662Author:WhitePublisher:Cengage
 Medical Terminology for Health Professions, Spira...Health & NutritionISBN:9781305634350Author:Ann Ehrlich, Carol L. Schroeder, Laura Ehrlich, Katrina A. SchroederPublisher:Cengage LearningLifetime Physical Fitness & WellnessHealth & NutritionISBN:9781337677509Author:HOEGERPublisher:Cengage
 Comprehensive Medical Assisting: Administrative a...NursingISBN:9781305964792Author:Wilburta Q. Lindh, Carol D. Tamparo, Barbara M. Dahl, Julie Morris, Cindy CorreaPublisher:Cengage Learning

Human Physiology: From Cells to Systems (MindTap ...
Biology
ISBN:9781285866932
Author:Lauralee Sherwood
Publisher:Cengage Learning


Basic Clinical Lab Competencies for Respiratory C...
Nursing
ISBN:9781285244662
Author:White
Publisher:Cengage

Medical Terminology for Health Professions, Spira...
Health & Nutrition
ISBN:9781305634350
Author:Ann Ehrlich, Carol L. Schroeder, Laura Ehrlich, Katrina A. Schroeder
Publisher:Cengage Learning

Lifetime Physical Fitness & Wellness
Health & Nutrition
ISBN:9781337677509
Author:HOEGER
Publisher:Cengage

Comprehensive Medical Assisting: Administrative a...
Nursing
ISBN:9781305964792
Author:Wilburta Q. Lindh, Carol D. Tamparo, Barbara M. Dahl, Julie Morris, Cindy Correa
Publisher:Cengage Learning
The Cardiovascular System: An Overview; Author: Strong Medicine;https://www.youtube.com/watch?v=Wu18mpI_62s;License: Standard youtube license